Using BIRT To Report On Bugzilla in MySQL
Using BIRT To Report On Bugzilla in MySQL
In this example, we are going to develop a BIRT listing report. We will use a bugzilla database installed on MySQL as our data source. What we would like to show in this report is a listing of all current bugs in the system. This will be a simple yet powerful report, showing groupings on Bugzilla Products and Components with totals, that should only take about 15 minutes to develop once you gain a modicum of familairty with BIRT.
Note that the steps in this example assume you have installed the 1.0.1 release of BIRT, which can be downloaded from http://www.eclipse.org/birt.
Report Design
Here's a rough design for our report with the groupings on Product and Component described earlier.
|
Product Name |
|||||||
|
|
Component Name |
||||||
|
|
|
Assigned To |
Severity |
Priority |
Status |
Op. Sys. |
Decription |
|
|
[component bug count] |
||||||
|
[product bug count] |
|||||||
BIRT Project
We start our report in Eclipse by creating a new Report Project from the Business Intelligence and Reporting Tools project.
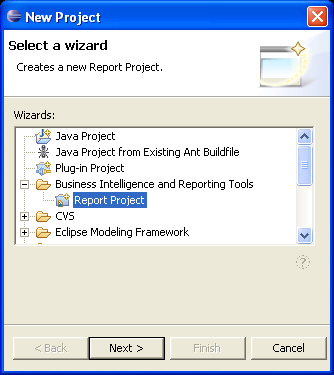
Clicking “Next >” will bring up the Project Name dialog. We will name our project BugzillaMySQLReports.
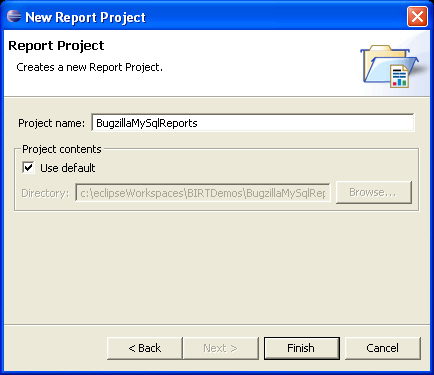
BIRT Report
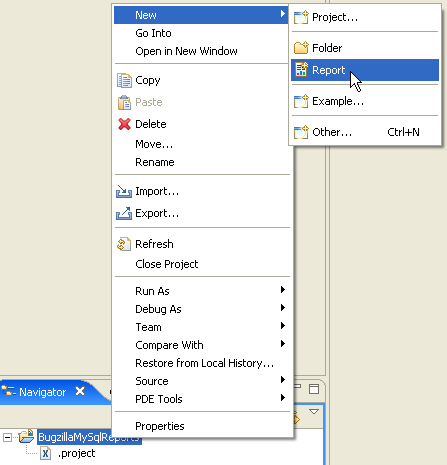
Next we'll create a new BIRT report in the project we just created. Right click on the project name and select New > Report as shown below.
This calls up the New Report dialog. We will name our report bugListing.rptdesign.
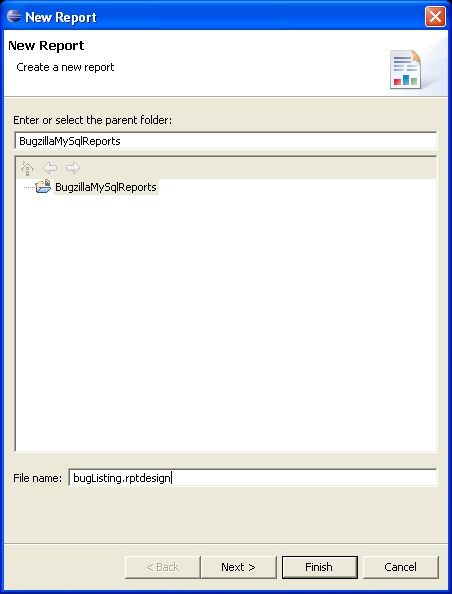
After clicking the “Next >” button, the Report Template dialog appears. For this example we will start off with a Blank report. We are not using any of the predefined templates because I want to show you how easy it is to create this report from scratch.
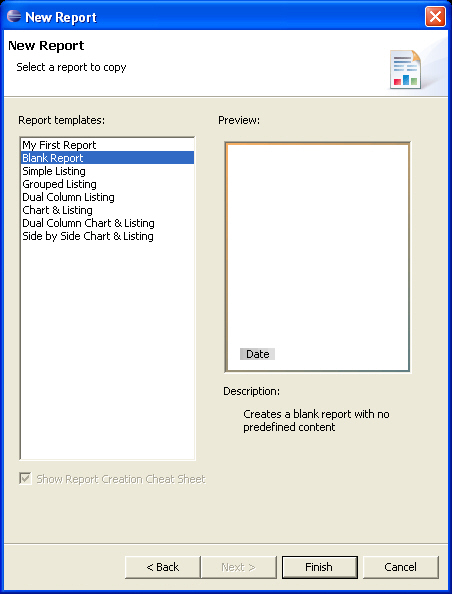
When you click on the “Finish” button a message box will appear asking if you would like to switch to the BIRT reporting perspective, choose to do so. At this point we have our blank report ready for us to start designing.
Data Source
The first thing we need to do is define a data source for our report. BIRT reports can have mulitple data sources from multiple disparate sources. In our example here we will be using a single data source that points to a Bugzilla database within MySQL. To call up the Data Source dialog we click on the Data Explorer tab in Eclipses Resource View as shown below.
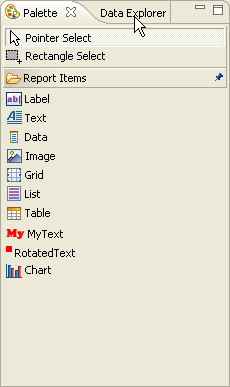
After switching to the Data Explorer view, right click the Data Source resource and choose New Data Source from the menu as shown below.


This will bring up the New Data Source dialog. In our example we will choose a Data Source type of a JDBC Data Source, and give out Data Source a name of srcBugs as hown below.
After clicking on the “Next >” button, the dialog for defining the data source will be display. Select a JDBC driver from the list, in our example it will be the com.mysql.jdbc.Driver class. In the database URL specify the connection, and in the username and password fields fill in the appropriate credentials. After you complete this click on the Test Connection button to see if the connection is successful.
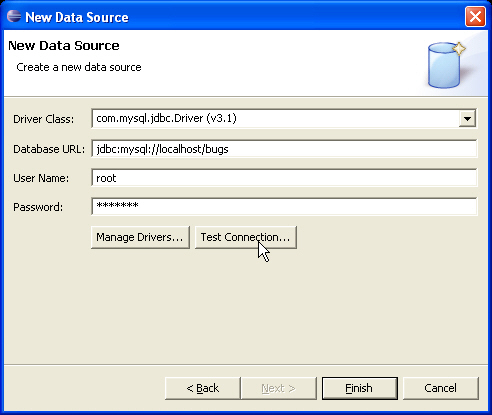
After clicking the “Finish” button, you will have a valid Data Source to use.
Data Set
Now that we've created a Data Source, let's create a Data Set which accesses it. To do this we right click on the Data Sets resource in the Resources View as shown below.
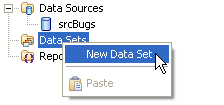
When we select New Data Set from the menu the New Data Set dialog appears. Here we will specify our Data Set Name, in our case lets call it setBugs. We set the Data Source that our data set will access to the Data Source we created earlier (srcBugs), and we leave the Data Set Type as SQL Select Query as shown below.
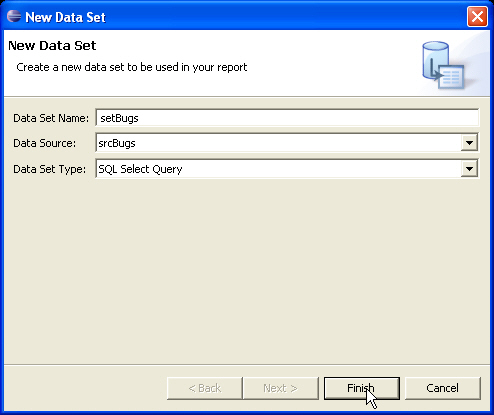
After we click the “Finish” button, the Edit Data Set dialog appears as shown below.
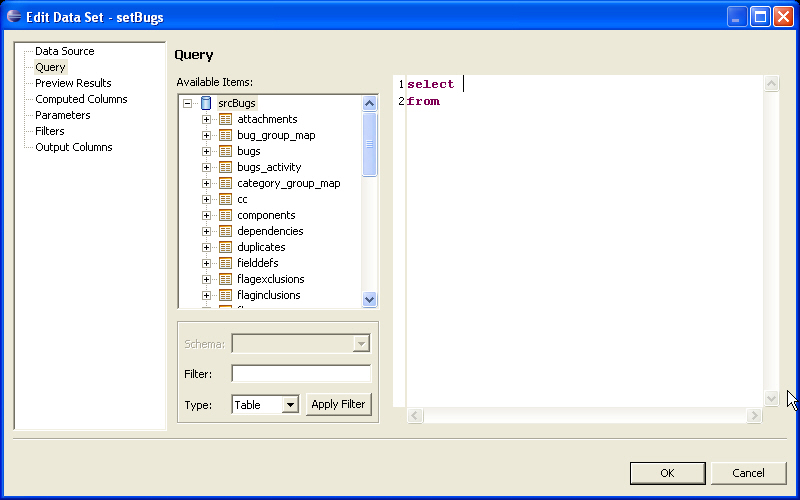
In this dialog, you can either drag tables and columns from the Available Items list or you can manually edit the SQL. For this exercise, it's easiest to type in the SQL statement directly.
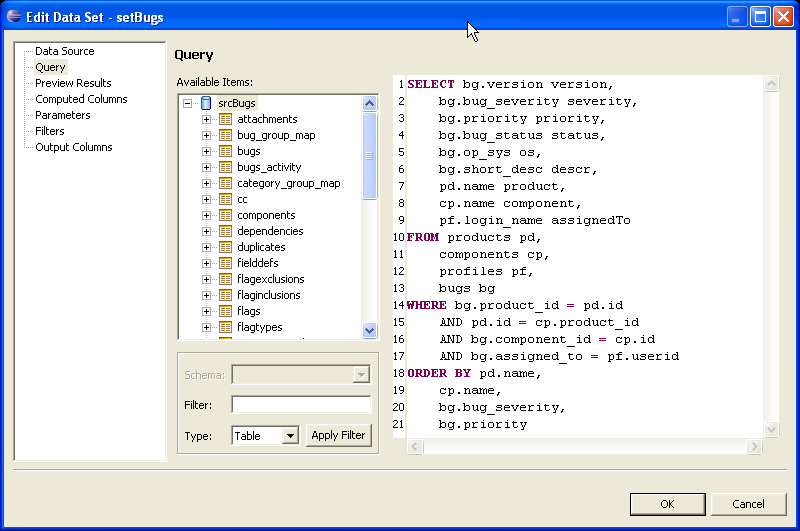
To copy and paste, use the following:
SELECT bg.version version, bg.bug_severity severity, bg.priority priority, bg.bug_status status, bg.op_sys os, bg.short_desc descr, pd.name product, cp.name component, pf.login_name assignedTo FROM products pd, components cp, profiles pf, bugs bg WHERE bg.product_id = pd.id AND pd.id = cp.product_id AND bg.component_id = cp.id AND bg.assigned_to = pf.userid ORDER BY pd.name, cp.name, bg.bug_severity, bg.priority
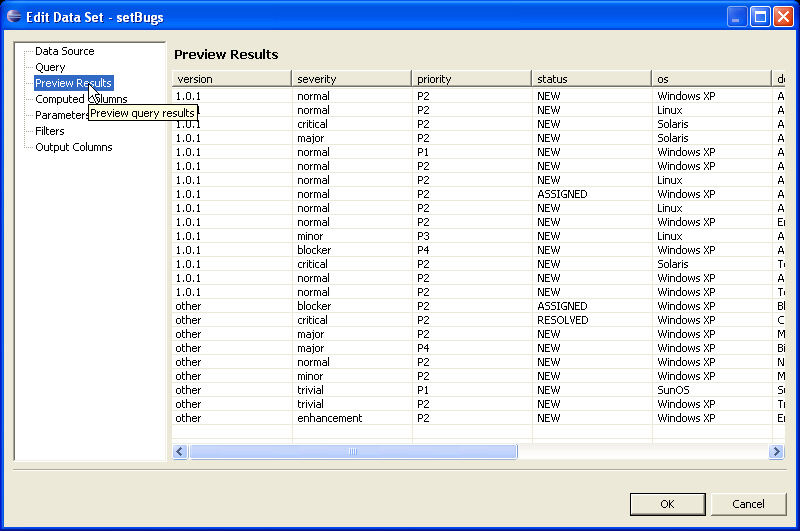
After entering the SQL, make sure it is performing the query we want by clicking in the Preview Results item in the list to the far left. Your data will naturally vary, but you should see the same fields as in the result set shown below.
Here is the resulting view in the Data Explorer resource view.
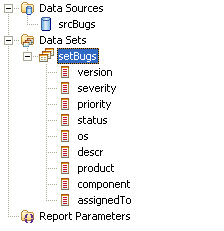
Now we're ready to design the report layout. Click on “OK” to close this dialog box.
Report Design
We will start by bringing the Palette to the foreground by clicking it's tab as show below.
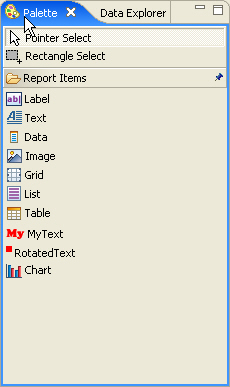
As you can see, the Palette presents all the controls that can be dragged onto the report design. We will start by dragging a Table control to the report. Table controls provide structure to the report and are "bound" to a data set, displaying data from the set in their "detail" rows. Grids, by contrast, are only used to provide structure and are not associated with a data set.
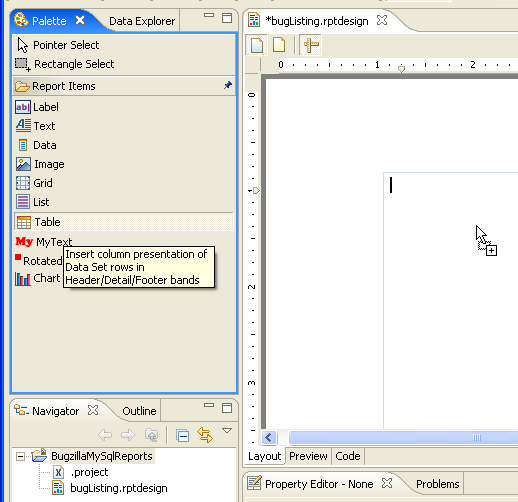
When we drop the table control on the report design, a dialog will appear asking how many columns and detail rows we'd like. We will choose 8 columns and 1 detail row.
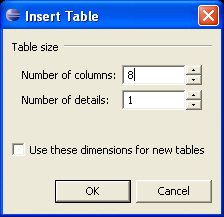
After clicking “OK” you will see the empty table control on your report design as shown below.

Now we can drag our data fields to the report. We will drag the fields from the Data Explorer and place them in the table's detail row.
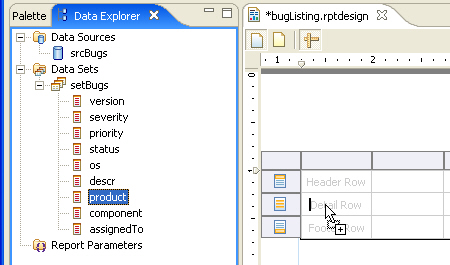
We will continue to drag all the fields to the table to produce the following.

Let's preview the results so far by clicking on the Preview tab at the bottom of the report design.
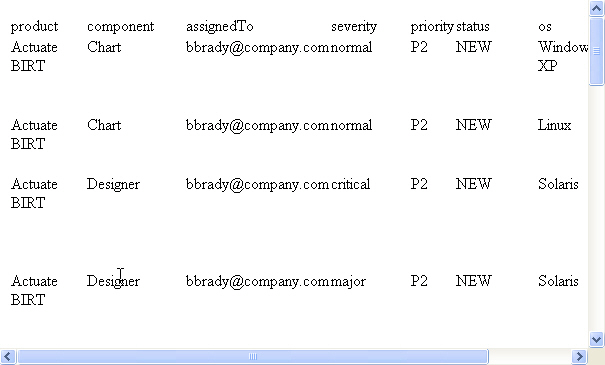
Not a very good looking report, but at least we have all the data required in a few easy steps.
To help make the report easier to read and to support the totals that we will eventually calculate, will will need to create some grouping sections. To do this, we will right click on the detail row and select Insert Group from the menu.
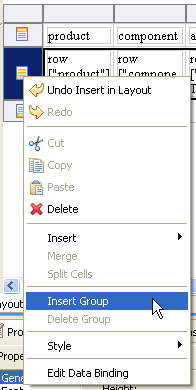
When you select the Insert Group menu item, a dialog will appear asking for the group definition. In our example, we supply a group name of ProductGroup and specify the product column as the column to group on.
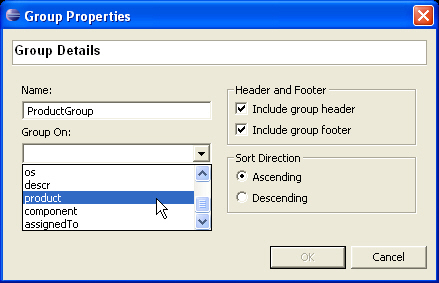
When you click on the “OK” button, a group header and a group footer are added to the table. The table will now "break" on each new product, display a header for it and then list all the associated rows.
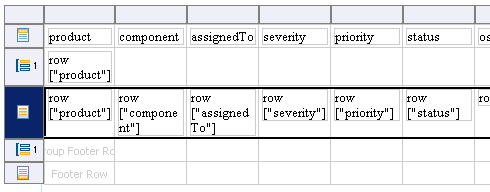
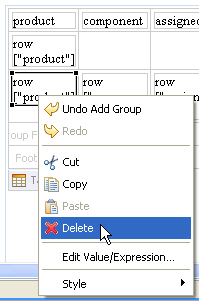
As you can see, the header automatically includes the data field that we are grouping on. Therefore, we do not need to repeat the data in the detail section, so we delete it.
Let's do another quick preview. This time, instead of using the Preview tab at the bottom of the report design, we will use the BIRT viewer button in the Eclipse toolbar to see what the report will look like when actually deployed. (And we'll use this method of preview for the remainder of the example.)

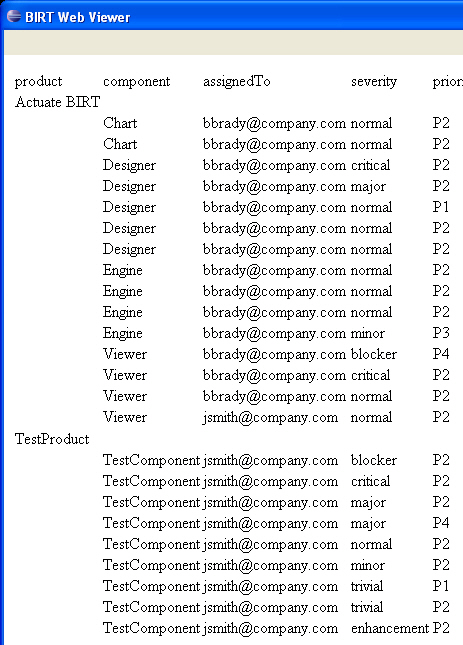
Still not a great looking report, but we've learned how easy it is to create grouping sections in BIRT. Now, we will create another group section and group on the component name. To do this, right click on the detail row in the report design, select Insert Group from the popup menu, and choose the grouping column as component.
After we do this grouping section we should have the following as our report preview.

Now we have our report grouped by product then by component. Next let's count the number of bugs for each of the components and display the totals on the report.
To create group totals, we simply drag a Data control from the Palette to the desired group section footer as shown below.
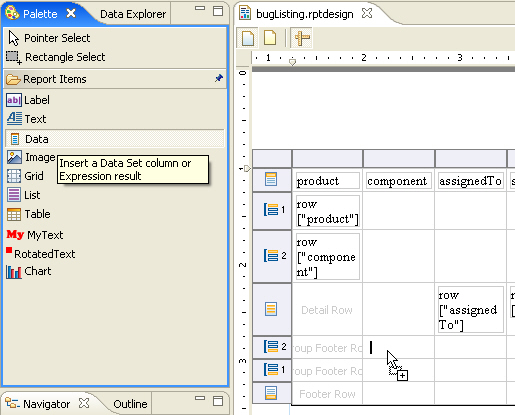
Note that we are dragging the data field to the second group section we created because we will first be creating the control for the component count for display. We will also total on the count for the product group but will do that next. The order here does not matter – just note that the data control have to be dragged in the corresponding footer for the desired group section we want to show the totals for.
Once the Data control has been dropped, BIRT's powerful Expression Builder is automatically invoked.
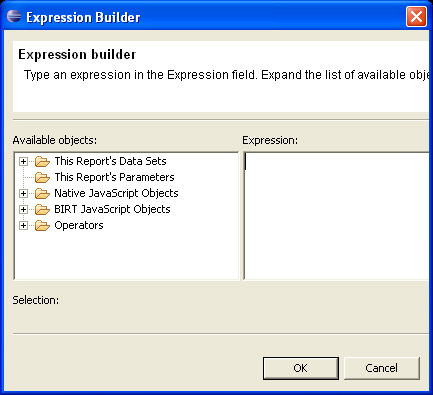
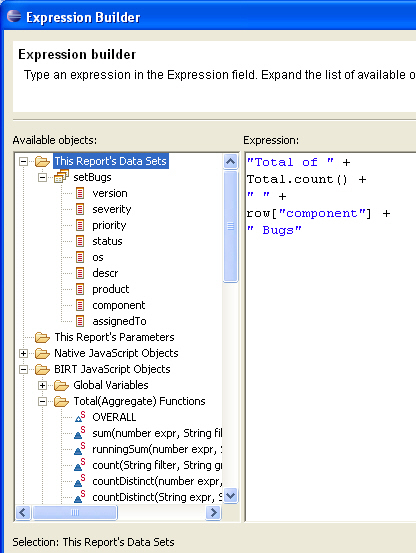
We make use of BIRT's built-in aggregate JavaScript functions to display the totals. First we add the Count() function to display the total number of rows in the group, and then we use string concatination to prefix the count with a label and display the component name and the literal "bugs" afterward. The aggregate and the row column values are added to the expression by double-clicking on the avaliable objects in the left column or by dragging them.
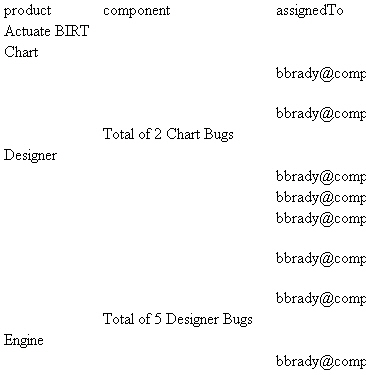
When we preview again we see the component group section totals.
Now we will create another group section total for Product. To do this, drag a Data control from the Palette and drop it in the group section footer for our product group. In the Expression Builder create the desired display using the product data column and the Count() aggregate function as we did earlier for our component group totals. When we are done our report will look like the following.
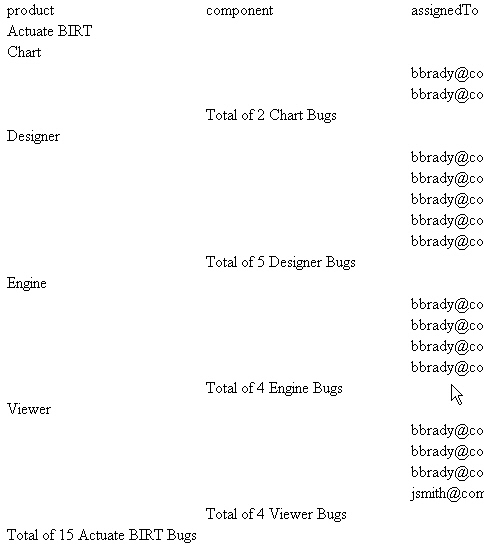
Still not a very good looking report but we have easily built in all the functionality we need. Now it's up to you to apply the formatting you'd like to achieve your desired look. Below is my final report after formatting.
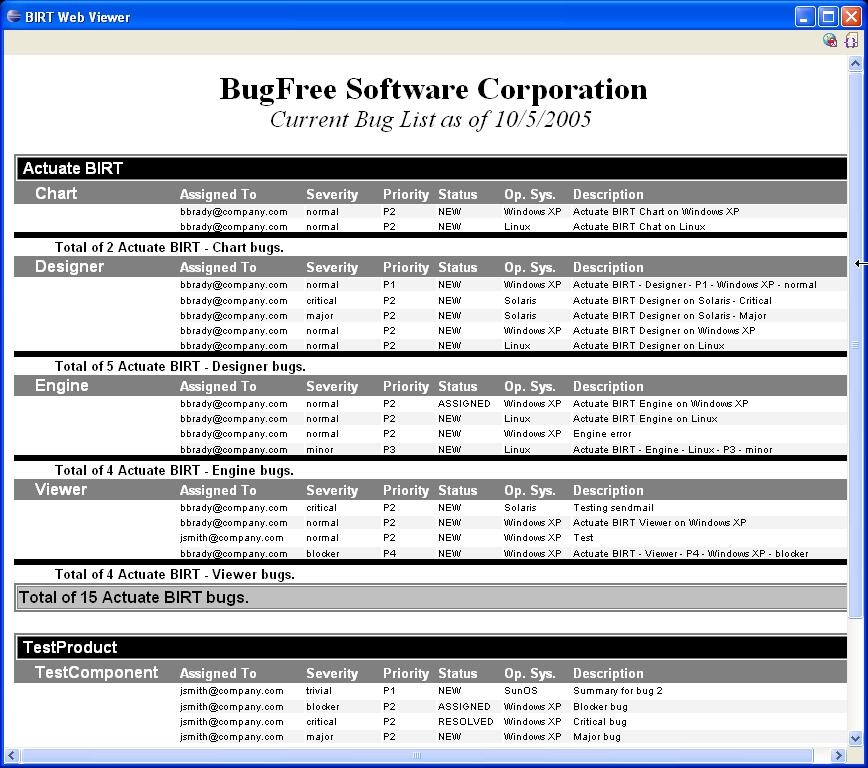
As you can see a pretty nice report can be built using almost your mouse exclusively. This report took about 15 minutes to build. You will see that you are also able to build reports with this functionality just as quickly and easily using BIRT.

