About the Author

Rob Young is a Senior Product Manager with the Sun Database Technology Group. He has over 20 years of database and application development experience with MySQL, Oracle, SQL Server, Sybase, and DB2. His primary responsibility is to work with the MySQL Enterprise Tools Engineering team on solutions that help DBAs and Developers scale their time, talent, and resources across the ever increasing number of MySQL servers he or she is destined to manage.
MySQL Developer, meet “Quan” (aka the MySQL Query Analyzer)
During my years as an application developer I was most in my element when working on projects that involved building applications from the ground up. Somehow taking user and customer pain points and requirements and turning them into a working solution was much more satisfying than upgrading an existing application, fixing bugs, or tracking down and tuning a slowdown, especially when these tasks involved code I had not created. Along the line, I developed and supported applications that ran on SQL Server, Oracle, DB2 (z390!) and MySQL, each of which posed some interesting twists when it comes to proactively tuning code as it is being developed and tested. Early versions of Visual Studio and SQL Server 7.0 provided pretty good application and stored procedure debuggers and the Microsoft Enterprise Manager provided a decent query profiler, although it only worked for a single server and was a little difficult to use if your queries spanned multiple data sources. Oracle 8i and later had the DBMS_PROFILER package and API that allows for the profiling of embedded PL/SQL statements in things like stored procedures and packages, which is good for finding bottlenecks in shared code objects. DB2, specifically on z390, is probably the most cryptic in providing query and SQL code tuning help and diagnostics, especially when coding in, gulp, COBOL and CICS (can you say “READY TRACE”?).
When I first started working with MySQL back in 2001, I appreciated its simplicity, data handling capabilities and overall performance. I was working at Embarcadero Technologies as the Product Manager over DBArtisan and Rapid SQL at that time and was working on a spec that would add support for MySQL 4.x to both products. After working on similar specs for Oracle, SQL Server, DB2 and Sybase specific features, I could not believe how easy it was to use SHOW commands and simple queries to return MySQL performance related variables and metrics. Everything was great! Then I tested some SQL code I developed that would be passed on to my Engineering team for inclusion in the next version of the product apps. It was then I realized that my options for collecting MySQL query diagnostics for a running application were somewhat limited and involved restarting my servers to enable this thing called the Slow Query Log and manually running SHOW PROCESSLIST from the MySQL command line to determine what queries were running and how long each was taking. Further, I had to then run the queries again to generate an EXPLAIN plan to understand which access path the MySQL optimizer chose for a specific execution. I thought, if it was this painful to write good queries for an app that I was creating from scratch, then how difficult would it be if I was under pressure and trying to find “good queries gone bad” in an app I had inherited or was babysitting with production support?
As Product Managers with MySQL, Robin Schumacher and I have heard loud and clear from customers and users that they love MySQL’s ease of use and reliability, but see it as a “black box”, specifically when it comes to identifying problematic SQL code. Polling of our Community and Enterprise users also reveals that finding problem SQL is commonly the #1 challenge they say that comes with deploying and scaling apps on MySQL. Unfortunately, the MySQL server is not well-instrumented to provide the query metrics needed to provide a compelling tool or solution that helps with this. With this in mind, a cross-functional technical team from MySQL Engineering and Product Management met in Amsterdam in early 2007 to explore how to provide low-level query activity stats outside of the MySQL server release schedule. Robin presented solutions the other dbms vendors provide, with an emphasis on the query analytics available the Oracle 10g Enterprise Manager. He and I defined the “what” behind the problem our combined team needed to solve, namely we needed to provide DBAs and Developers with a MySQL solution that provided a quick, easy way to find their most expensive, resource hogging queries while working within the constraints of the MySQL server. We had built similar solutions around Oracle, SQL Server, DB2 and Sybase while working for Embarcadero Technologies, but MySQL presented a bigger challenge as it provided no true data dictionary or performance interface to gather the needed statistics. We discussed things like pulling the relevant MySQL logs and SHOW PROCESSLIST result sets into the Enterprise Monitor for formatting and correlation analysis. This is OK, but not much more beneficial that what many MySQL users are currently doing on their own.
I will never forget the moment the conversation shifted from Product Management’s “what” to Engineering’s “how” (ideally, this is how the product development life cycle truly begins, but I digress…). Jan Kneschke of the MySQL Enterprise Tools engineering team and author of the MySQL Proxy said something like, “we could use the Proxy to collect and aggregate queries as they run and send them back to the Monitor for analysis…” In that moment, the MySQL Query Analyzer or “Quan” was born.
Traditional Query Monitoring
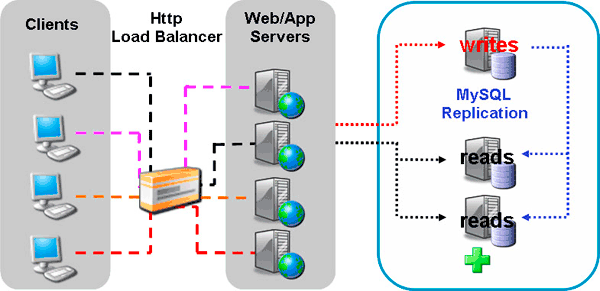
Before jumping into details around Quan, it may first help to cover some of the customer feedback and use cases we have gotten on the challenges of monitoring queries as apps are implemented on a scale-out/up architecture with MySQL. The most popular and commonly used feature for developing and scaling apps on MySQL is replication, which ships with every version of the MySQL server. It is very easy to use and setup, very reliable, offers high rates of transfer speed and is used primarily to “scale-out” an application, by using different physical servers to make up one logical, horizontally cloned database. In a scale-out deployment, apps are developed and deployed with separate connection handlers for read/write splitting allowing them to direct read activity to dedicated read slaves, freeing up the master to service only writes.

This common deployment adds complexity to the tuning of underlying queries during development and QA, mainly because (in a load balanced environment) queries execute across multiple data sources and may perform differently depending on the load or configuration of the target server. It is also difficult to determine the total expense of a specific query across a replicated database as query stats (via the General Log or an enabled Slow Query Log) are kept locally and not readily available for aggregation.
Enabling the Slow Query Log
A common method for monitoring queries in the above deployment is to enable the Slow Query Log on each of the read slaves to capture queries as they run. The Slow Query Log is enabled by starting the monitored MySQL server, or read slave in this case, with the --log-slow-queries[=file_name] option. When enabled the Slow Query Log lists queries that took longer than X seconds (user defined value typically between 1 and 10). The entries in the Slow Query Log are formatted to include client IP address, date/time the query started, execution time, rows sent to client, rows read and finally the query content. A typical entry looks like this:
# Time: 08073101 16:25:24
# User@Host: root[root] @ localhost [127.0.0.1]
# Query_time: 8 Lock_time: 0 Rows_sent: 20 Rows_examined: 243661
SELECT part_num FROM `inventory`.`parts` WHERE
(`vendor` = "foo") ORDER BY `delivery_datetime` DESC LIMIT 100;
While the Slow Query Log provides good insight into expensive queries it comes with some known limitations:
- Prior to 5.1, the MySQL server had to be stopped and restarted for it to be enabled. This is more of an issue after an app has been promoted to production, but still inconvenient during development.
- When enabled, the log grows very large, very quickly. Even development and QA servers must be managed via scripts using FLUSH LOGS.
- The log entries must be parsed and manually sorted for relevance to determine which queries need tuning before moving to production. Logged queries can be summarized using the mysqldumpslow command but this is still somewhat tedious and time consuming and yet another utility to be mastered.
Using SHOW PROCESSLIST
The MySQL SHOW PROCESSLIST command allows you to see what processes are currently running on your MySQL development servers. The results are formatted to include the process id, user, originating host, database, command type, status and info, which includes the executing query when applicable. The output looks like this:
mysql> SHOW FULL PROCESSLIST\G

*************************** 1. row ***************************
Id: 1
User: MyUser
Host: localhost
db: merlin
Command: Query
Time: 1030455
State: Sending Data
Info: SELECT * from advisors;
*************************** 2. row ***************************
Id: 2
User: MyUser
Host: localhost
db: inventory
Command: Query
Time: 1004
State: Sending Data
Info: SELECT part_num FROM `inventory’;
2 rows in set (0.00 sec)
Retrieving Slow Query Log files/entries and SHOW PROCESSLIST result sets can be automated via custom scripts. In fact, many development teams use the Slow Query Log in conjunction with SHOW PROCESSLIST to monitor their MySQL applications for poorly performing queries during QA and load testing cycles and then perform iterative tuning until the app is deemed ready for production. A typical scenario involves custom scripts that:
- Are deployed to each MySQL dev/QA server or read slave
- Parse the Slow Query Log for queries that exceed a specific execution time threshold
- Execute SHOW PROCESSLIST, capture and aggregate the results for analysis
- Perform FLUSH LOGS to manage growth during intense load testing
The development team then manually collects the resulting files and parses through the aggregated data to determine which queries are candidates for optimization.
Using EXPLAIN
After a problem query is identified, the EXPLAIN statement can be used to answer questions likeare indexes being used effectively, whether a filesort is required, and what tables and columns are being queried. The EXPLAIN statement supports many options, but the typical output looks like this:
Query in:
EXPLAIN SELECT part_num FROM `inventory`.`parts` WHERE
(`vendor` = "foo") ORDER BY `delivery_datetime` DESC LIMIT 100;

EXPLAIN out:
ID select_type table type possible_keys     key     key_len ref  rows Extra
1  SIMPLE      parts ref  vendor, part_num  vendor  3       NULL 3872 Using WHERE
1 row in set (0.00 sec)
The EXPLAIN output is really the final stop in tuning code that is primed for production, although the MySQL profiler that is new in 5.1 is also proving valuable for iterative tuning. Using these utilities developers tune the code by adding indexes, altering table columns for length or datatype or changing the query structure itself to improve performance. This is typically done iteratively (tune, EXPLAIN query, tune some more) until the query is tuned or performs within service level agreement boundaries.
Enter Quan
Quan is designed to save development time on query coding and tuning by expanding on all of the good things found in the Slow Query Log, SHOW PROCESSLIST; EXPLAIN plan, and 5.1 profiler all with no dependence of any of these atomic things. To this end, we integrated Quan into the Enterprise Monitor so developers can monitor security, performance, availability AND all of their queries across all their MySQL servers from a single, consolidated view. Before I delve into what this view actually shows and how it helps with query development, let’s look under the covers at how Quan is enabled and how it leverages the MySQL Proxy chassis I mentioned early on.
How Quan works
If you are familiar with the MySQL Proxy you know that it is a lightweight C app that sits between your client and your MySQL server and allows you to monitor, analyze and transform its communication via the standard MySQL protocol. It is comprised of a core, pluggable chassis that is extensible via LUA (you can learn more and download the MySQL Proxy here: http://dev.mysql.com/downloads/mysql-proxy/index.html ). You can use the Proxy chassis under the GPL and build your own LUA extensions for query collection and analysis and advanced things like load balancing, connection pooling, failover, query filtering, to name a few.
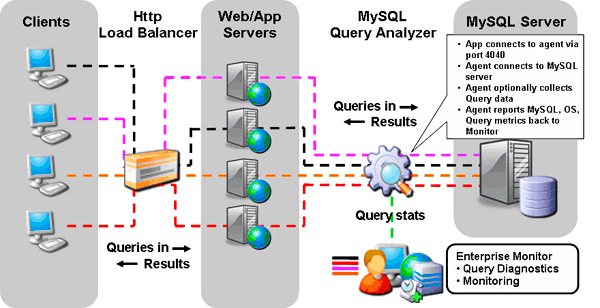
Quan leverages the MySQL Proxy and MySQL custom LUA scripts to extend the Monitor Service Agent to listen on a user defined port for app queries, collect and aggregate the SQL code and performance metrics, and then report the results back to the Monitor Service Manager so they can be analyzed using the Monitor’s Enterprise Dashboard. A common deployment of the Monitor and Quan might look something like this:

In this example, the agent is installed on the monitored MySQL server and is configured to either collect queries (the default) or to serve as pass-thru until collection is enabled. The configuration is straightforward:
- The app is configured to connect to the Service Agent/Proxy on a user defined port (4040 by default).
- Service Agent/Proxy connects to MySQL server (single server, master, read slave).
- Service Agent/Proxy is enabled to collect queries at all times or only during active testing cycles.
- Service Agent/Proxy reports MySQL, OS, and query metrics back to Service Manager for monitoring.
How does Quan help?
Quan is designed to save you time developing and supporting your apps by finding queries that need your attention before they are rolled into production.

It provides:
- An integrated development and monitoring solution for all supported versions of MySQL (4.1 and higher).
- Aggregated query content and performance stats in real time with no reliance on MySQL logs, SHOW PROCESSLIST or MySQL 5.1 profiler.
- Visual correlation of query activity with Monitor graphs.
- A consolidated view into query activity across all MySQL servers, no user parsing required.
- Historical browsing/analysis/benchmarking of queries across all MySQL servers.
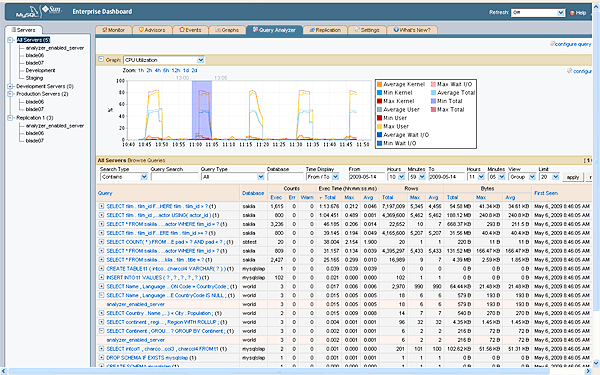
- Aggregated, searchable roll ups of all queries in canonical form (no variables) with total number of executions, total execution time, total data size and date/time of when query was “first seen”:
- Total Executions helps you see if you have queries that are running too often or in error. This helps you find possible app logic or looping problems.
- SQL Warning and Error counts help you see queries that did not finish or that returned incorrect result sets. These executions are commonly never found during development.
- Total Execution Time helps you see your most expensive queries across all of your servers. This value helps you see where your systems are spending the most time and resources, and where you should focus your development tuning efforts.
- Total Data Size (Rows and Bytes) helps you analyze if you have queries that are returning more (or less) data than your application is using. Sorting on this value, examining the underlying queries and comparing the returned rows and columns with your application requirements will help you tune your applications and schema for better performance. Can you app really use or display 2,000 rows of data? Or do you have queries that are churning and only returning a small number of rows? This metric is key to identifying where you can use simple look up tables or caching to eliminate query executions and speed up your app.
- “First Seen” allows you to easily monitor when new queries or code check ins have occurred. Good for pinpointing when someone “broke” the build or promoted code that killed test or QA performance.
- Drill downs into query details, number of executions, execution stats, visual EXPLAIN plan, and query specific execution graphs. This helps you see the grainy details that you commonly would interactively use the Slow Query Log, SHOW PROCESSLIST;,CLI EXPLAIN or 5.1 Profiler to pull together. You can get all these things automatically, across all servers, in seconds with Quan.
What about overhead?
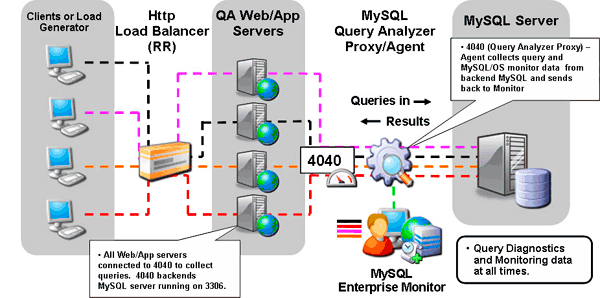
While the benefits of using Quan are obvious, the first logical question to ask is how much overhead does enabling it add to my application? The best answer is; it depends. Users have reported varying levels of overhead (none have been overly concerned) depending on the QPS for the app being monitored. Personally, I believe all projects benefit from having Quan enabled at all times during active development and QA testing so all queries across all servers can be captured and their total expense assessed and tuned where needed. In this scenario, a common deployment will be similar to:

I also recommend that developers benchmark their apps with and without Quan enabled to assess if it should be enabled during user and acceptance testing (and ultimately production deployment), when user response times are really being put to the test. Enabling active query collection with the Service Agent/Proxy is controlled using the Enterprise Dashboard and allows you to enable query collection for individual servers or complete applications throughout the development unit testing and QA cycles so you can customize your use to monitor any combination of servers.
Conclusion
The MySQL Query Analyzer or Quan provides a nice alternative to the traditional methods of collecting and analyzing query statistics when you are first developing and tuning your apps. Several users have reported substantial (up to 3x) performance gains in their apps during unit and QA testing, mostly due to queries Quan surfaced during active development (that they normally would have found after the app was promoted to production). We actually used Quan on itself while it was under development and identified, tuned, and eliminated a number of queries (e.g. do we really need to be executing AUTOCOMMIT 39,000 times every hour?) that were impacting the ability of earlier versions of the Enterprise Monitor to scale, so we have collectively eaten our own dog food on its value so to speak. In the newest version, we have correlated the Monitor system graphs with query activity so you can highlight or “grab” spikes in any of the graphs and open up Quan filtered to show the queries that were running during the selected time frame. This should help you visually and more easily find any queries that may be draining your key system resources during specific windows of time. Look for this feature to be ready for customer beta and trial users in the next few weeks.
If you want to start finding you most expensive queries now, then I’d encourage you to take a trial of the Enterprise Monitor and Query Analyzer that’s contained within it – you can get started by aiming your browser at: http://www.mysql.com/products/enterprise/. Once you start using the Query Analyzer, I think you will like how many benefits it provides.
Thanks, as always, for supporting MySQL and Sun!

