About the Author

Rob Young is a Senior Product Manager with the Sun Database Technology Group. He has over 20 years of database and application development experience with MySQL, Oracle, SQL Server, Sybase, and DB2. His primary responsibility is to work with the MySQL Enterprise Tools Engineering team on solutions that help DBAs and Developers scale their time, talent, and resources across the ever increasing number of MySQL servers he or she is destined to manage.
3 Tips for Customizing MySQL Enterprise to Achieve Monitoring Best Practices
During my years as a Developer/DBA hearing the words "customizable" or "extensible" always brought a slight smile to my face, particularly when they were used in conjunction with a software sales pitch or evaluation. In fact, more often than not, while presented as product features, these words often really mean, "you can do some additional things with this software if you are willing to invest significant time and resources into doing so". Even today, some of the most popular open source and commercial software solutions provide application programming interfaces (APIs) and plug-ins that are really nothing more than containers that allow you to provide your own code. The goal being to make an off-the-shelf product more applicable to the problems you are attempting to solve without having to write a customized application from scratch.
I write these words with a little trepidation as I am now at the helm of the MySQL Enterprise Monitoring and Advisory Service which allows users to extend key application features to best fit their internal requirements. Now before that smile on your face begins to cramp, I should say that the Monitoring and Advisory Service provides an advanced feature set that many users will find complete and in no need of customization. Additionally, we provide customization options for users with advanced needs or who have a deep understanding of the over 600 MySQL variables and OS metrics that are available for monitoring. MySQL Enterprise also allows anyone to integrate our MySQL specific monitoring capabilities with an existing infrastructure such as OpenView, Tivoli, Nagios, and Cacti. To this end, I think you'll find the customization options well documented and easy to work with.
For the purpose of this article I will focus on customization tips for three specific areas of the Monitoring and Advisory Service. We'll start with Advisors and Rules and then move into Alerts and Notifications. Finally we'll take a look at scheduling options that allow you to disable/enable monitoring around maintenance windows or other calendar-based events such as weekends and holidays.
Tip 1 - Customize Your Advisors
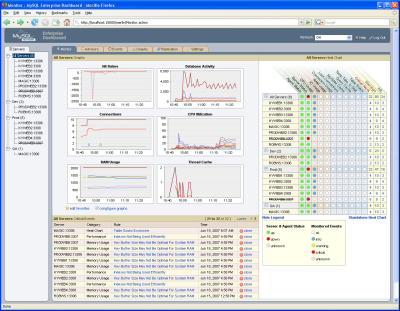
The Monitoring and Advisory Service is comprised of a web-based Enterprise Dashboard which provides you with a visual means of monitoring the health, performance and availability of all your MySQL servers in the same place at the same time. Behind the Enterprise Dashboard is a set of intelligent Advisors that constantly scan your MySQL servers and proactively let you know of security, replication and performance related problems and tuning opportunities before they negatively impact your system. Each of these Advisors provides a set of rules that test specific metrics and variables against MySQL recommended best practices. If a violation is detected, an alert is raised, complete with a detailed, recommended course of corrective action that reduces the time that would otherwise be spent reactively fixing the problem.
If you are familiar with the Monitoring and Advisory Service Enterprise Dashboard, you know that working with Advisors and scheduling the underlying rules against your MySQL servers is very straight forward. Basically, you install and configure an agent on each of your MySQL servers, the agents are auto detected by the Enterprise Dashboard and then you are ready to schedule Advisor rules via the Enterprise Dashboard web interface. What you might not know is that extending the MySQL Advisor rules or even creating your own is an easy proposition as well. The easiest way to extend an existing rule is to simply open the "Advisors" tab and click on the link to the Create/Edit Rule page. Once there, expand the Advisor of choice and select either Edit or Copy. Using Edit you can adjust Advisor rule violation thresholds to best meet your needs. For example, say you have a production MySQL server that back ends one of your most active online applications. To meet customer loads and application database requests, you decide to monitor for maximum connection limit and to take some action when connections begin approaching some set limit. The rule we provide to do this is under the Administration Advisor:
"Maximums Connection Limit Nearing Or Reached"
And the expression that detects if the rule has been violated is:
(((%Threads_connected% / %max_connections%) * 100) > THRESHOLD)
Which can be interpreted as:
"Please tell me if the percentage of threads_connected to the number of max_connections for this specific server is greater than some threshold so I can take some action."
Note that we use variable substitution for the above expression. When the rule is executed against the target server or servers, the values stored for the variables involved are plugged into the expression and the result of the computation is compared to the threshold value. Using the Edit functionality you can set the threshold values for what constitutes Critical, Warning and Information level alerts.
Taking the same example a bit further, what if you have production and development servers that have the same monitoring needs but different allowable threshold levels? For this we provide the ability to create new Advisor rules or to copy our existing rules and modify them to fit your specific needs. Using the example above, you can use the Create Rule at the top of the Create/Edit Rule page or more simply the Copy link next to the "Maximum Connections Limit Nearing or Reached" to open a full-blown rule editor that allows you to change any of the rule properties and then save the edited rule as new. Say you determine that your development servers need to be monitored for max connections but only after they have been up and running for 3 or more hours, you can use the editor to change the rule expression to include a check of the MySQL UpTime variable for the servers in question. After adding the variable using the Variable Assignment control the update expression would be:
(%Uptime% > 10800) &&(((%Threads_connected% / %max_connections%) * 100) > THRESHOLD)
Note: MySQL stores Uptime in seconds. 10800 seconds = 180 minutes = 3 hours.
Which can be interpreted as:
"After my server has been up for more than 3 hours, please tell me if the percentage of threads_connected to the number of max_connections for this specific server is greater than some threshold so I can take some action."
After your edits are complete, save the new rule under a custom name (how about "Maximum Connections Limit Nearing or Reached – Dev"?), then it becomes available for scheduling against the target servers. Keep in mind that the above principle holds true for all properties of a rule you are copying or creating for your own use. Users are encouraged to extend the MySQL supplied rules to include customized problem descriptions, advice, recommended actions (things like "Contact Betty in accounting when this happens!") and links to their own documentation.
Note that the Monitoring and Advisory Service uses the MySQL database server's expression parser and evaluator when interpreting Advisor rule expressions. For a complete list of operators and functions see http://dev.mysql.com/doc//refman/5.0/en/functions.html.
Tip 2 – Target Your Alerts and Notifications
As an operational DBA one of my biggest challenges was sifting through piles of information and determining those things that demanded my immediate attention. Based on my conversations with my colleagues in the MySQL user community I find this to be a common source of pain. With this in mind, the Monitoring and Advisory Service allows you to specify when alerts are sent (via the aforementioned rule thresholds) and to define specific notification groups and network defined alerts so that only those with an interest in a particular issue are notified.
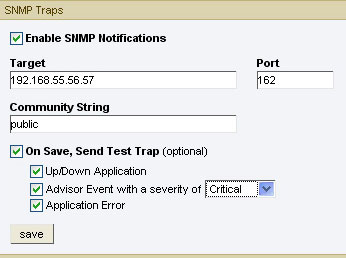
Again, referring to the web-based Enterprise Dashboard, using the Settings tab you can enable notifications using email via SMTP and network enabled nodes via SNMP.

For SNMP notifications the target IP and port can be for any SNMP enabled node on a network, so you can integrate the MySQL network alerts into your existing infrastructure (OpenView, Tivoli, Nagios, Cacti, etc.).
For email notifications, controlling the flow of information to only those with a vested interest in a specific issue can be set up using the Manage Notification Groups page accessed via the Settings tab. Here you can create custom email notification groups based on application, department, area of responsibility, production, development, etc. In this example I have set up specific Security_Admin, DBA and Development email notification groups.


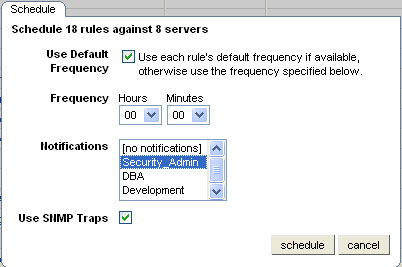
These groups are then available for assignment when specific Advisor rules are scheduled. Here I am scheduling all Security Advisor rules against all of my production servers. Note that when scheduling specific rules you have access to direct all best practice violation notifications and alerts to any combination of the notification groups you have defined. You can also override or enable if these same violations are sent to the SNMP enabled nodes mentioned above.
Tip 3 – Script Around Your Maintenance Windows
Despite our best efforts for 100% uptime and availability, all production servers will eventually need some form of regular maintenance (for backup, recovery, hardware/software upgrades, etc.). To help eliminate the "chatter" that may be generated by Rules firing against dormant servers we have built an interface into the Monitoring and Advisory Service that allows you to define Advisor scheduling black out periods that suspend Advisor Rule evaluation and notifications during these maintenance windows. During a scheduled black out period the Service Agent will continue to collect data for graphing and trending purposes but all Service Manager Advisor Rule evaluation and notifications are put on hold.
There are two ways to leverage black out periods during your planned maintenance window. First you can interactively suspend the Advisors Rules you have scheduled for a specific monitored server by entering the following URL in your browser, substituting the appropriate hostname, port and monitored server name. Here I am suspending all Advisor Rules that are scheduled to run against monitored server "DEVAPPS" that reports in to Service Manager "Service_Manager1" that is listening on port 10080:
http://Service_Manager1:10080/merlin/inventory?command=blackout&server_name=DEVAPPS&blackout_state=true
After entering the URL an HTTP authentication dialog box will open where I will enter the Monitoring and Advisory Service server administrator's credentials and viola! Advisor Rule execution against DEVAPPS will be suspended. When server maintenance is complete I'll use the same URL to reactivate the blacked-out monitored server, but I will set blackout_state=false.
I can automate the above by wrapping an OS specific script around the URL call noted above and adding the script to my existing job streams. To do this first I develop my parm driven script, in this case using Perl, and include an embedded call to the above URL:
#!/usr/bin/perl

   use LWP 5.64;

   # USAGE:  MyBlackout.pl <localhost:8080 admin password 3306_10:3306 true
   # $ARGV[0] = Service Manager hostname:port
   # $ARGV[1] = Service Manager server userid
   # $ARGV[2] = Service Manager password
   # $ARGV[3] = mysqld monitored instance server name
   # $ARGV[4] = blackout state (true/false)


   my $browser = LWP::UserAgent->new;
   $browser->credentials(
    $ARGV[0],
    'merlin',
    $ARGV[1] => $ARGV[2]
  );

   my $url = URI->new('http://'.$ARGV[0].'/merlin/inventory');

   $url->query_form(  # And here the form data pairs:
    'command' => 'blackout',
    'server_name' => $ARGV[3],
    'blackout_state' => $ARGV[4]);

   my $response = $browser->post( $url );

   if ($response->is_success) {
     print $response->content ;
   }
   else {
      die $response->status_line;
   }
After that I will schedule calls to the script for each of the monitored servers that I want to suspend. Here is an example of scripting a blackout period around the DEVAPPS server noted above using crontab:
/etc/crontab:
SHELL=/Bin/Bash
PATH=/sbin:/bin:/usr/sbin:/usr/bin
MAILTO=ryoung
HOME=/ryoung

00 3 * * * ryoung/path/to/MyBlack_Out.pl Service_Manager1:18080 myuser mypassword DEVAPPS true
10 3 * * * ryoung/path/to/MyMaintforDEVAPPS
00 4 * * * ryoung/path/to/MyBlack_Out.pl Service_Manager1:18080 myuser mypassword DEVAPPS false
Conclusion
The MySQL Monitoring and Advisory Service provides a consolidated view into the health, performance and availability of all of your MySQL servers. Out of the box, it is designed to proactively identify problems and tuning opportunities before they turn into fire-drills. It also provides you with MySQL "virtual DBA" expertise to help you determine the best course of action for specific issues. In line with MySQL's commitment to the user experience, you can customize much of the core functionality of the Monitoring and Advisory Service to best fit your needs. This article hit on 3 areas that you might find useful as you gain experience using the product. MySQL Enterprise subscribers can explore all of the customization options by downloading the product documentation from https://enterprise.mysql.com/monitoring/download.php.
For more information on MySQL Enterprise and the Monitoring and Advisory Service please visit the MySQL website at http://www.mysql.com/products/enterprise/advisors.html where white papers, demos and more are available. And if you'd like to try out the Monitoring and Advisory Service for yourself, please email us at trials@mysql.com.
Thanks, as always, for supporting MySQL!
Comments?
Read and post comments on this article in the MySQL Forums. There are currently 0 comments.


