About the Author

Robin Schumacher is MySQL's Director of Product Management and has over 13 years of database experience in DB2, MySQL, Oracle, SQL Server and other database engines. Before joining MySQL, Robin was Vice President of Product Management at Embarcadero Technologies.
Automating MySQL Best Practices Management
One thing I learned fairly early in my DBA career was that if I was ever going to excel in managing the databases under my care, I needed to do one thing: smartly automate as much of my job as I could. This became particularly important in my last full-time DBA spot where one other guy and I had responsibility for about 120 Oracle, SQL Server, and DB2 databases. A lot of these databases ran critical applications with lots of users, so we were rarely bored at work. To keep our heads above water, we needed to do something to ensure we always had our finger on the pulse of all our servers, plus we needed to make sure that any performance issue was recognized as early as possible.
I ended up writing an in-house monitoring and capacity planning system that had a Web front end with a lot of moving parts under the covers. It worked pretty well for what we needed, with me even providing an end user dashboard where users could go to check on their applications before ever calling me (probably one of the smartest things I did in the system…) The problem was that as we grew, I ended up spending more and more time enhancing the home-grown monitoring solution, plus I became aware that there were shortcomings in the system that I couldn’t really overcome on my own. This, unfortunately, is the normal life cycle of home-grown help aids.
For many years, MySQL professionals have had to travel down this path or massage limited free offerings to meet the needs of their IT infrastructure. As I’ve traveled and spoken to many MySQL customers, I’ve heard about the pains they have with doing such things, even in very technically-savvy shops. In addition, I’ve fielded the complaint that the MySQL server can sometimes be too much of a “black box” when it comes to knowing if the server is running well or not. Basically, DBAs need to be able to easily tell if MySQL is responsible for a perceived slowdown in overall performance, or if the problem exists somewhere else (e.g. the network, etc.)
The good news is that we’ve taken all this user input and have recently introduced a new service within the MySQL Enterprise offering that can help. The MySQL Enterprise Monitoring and Advisory Service has been designed to eliminate the need for building home-grown MySQL monitoring solutions, plus it helps jump start folks who are new to MySQL and unsure about how best to configure and tune MySQL for optimal performance. Perhaps most importantly, it lets you get ahead of performance issues before they cripple you key applications, and it lets you extend the service with customizations that are needed for your particular environment. Let me show you just a few reasons why you as a DBA will like what you see in the Monitoring and Advisory Service.
What is the Monitoring and Advisory Service?
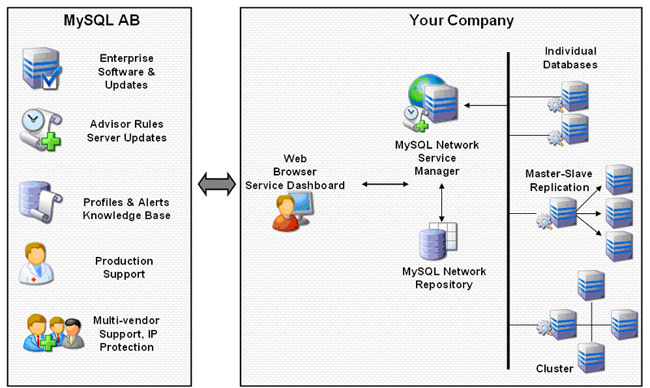
First, let’s get a quick understanding of what the Monitoring and Advisory Service is and how it works. Provided as part of MySQL Enterprise, the MySQL Enterprise Monitoring and Advisory Service is a “Virtual DBA” assistant helps manage all your MySQL servers with respect to performance tuning and general best practice management. In other words, how best to setup and maintain your MySQL servers for optimal uptime and response times. Running completely within your firewall (see Figure 1), the Monitoring and Advisory Service will monitor your database environment and provide expert advice on how to fix any best practice deviations it finds.

Figure 1 – The Monitoring and Advisory Service Architecture
Briefly, the architecture consists of the following components:
- The Service Manager, which is the “brains” of the service. It controls the various aspects of what goes on behind the scenes of monitoring servers and notifies DBAs of issues that are found. The Service Manager is written in Java Servlets.
- The Service Agent, which carries out the actual interrogation of each MySQL server (both the server machine and the MySQL Instance) with respect to up/down information and performance statistics. The Service Agent is written in C.
- The Repository, which is used to hold current and historical statistics regarding the health of each monitored server. The repository is (obviously…!) a MySQL database located somewhere on your network.
- The Enterprise Dashboard, which is a web-based interface that allows a DBA to visually see everything that is going on in their MySQL environment and manage various aspects of the service. The Enterprise Dashboard is written in PHP.
Powering the Monitoring and Advisory Service are a set of best practice Advisors, each of which consists of numerous rules that are used to enforce standards – around-the-clock if desired – for security, performance, replication management and more. These rules have been written by the pro’s at MySQL who know what makes the database server tick and how best to secure and tune things so no unpleasant surprises come up. In addition to the out-of-the-box supplied Advisors and rules, the service can be customized through you adding your own rules or tweaking the existing rules so they exactly match what you need.
With a brief understanding of what the Monitoring and Advisory Service is, and how it functions, let me now show you the things I think you’ll like about it from a DBA perspective.
Automation of Best Practice Enforcement
The first thing I like about the Monitoring and Advisory Service is that it lets me easily automate the enforcement of all key MySQL standards for security, performance, configuration, and more. This is done through the following steps:
- Select what MySQL servers you want to monitor through the Enterprise Dashboard.
- Select what Advisors/best practice rules you want to run against your monitored servers.
- Schedule how often you want the Advisors/rules to run against each server (or group of servers).
- That’s it.
Once I walk through those few steps, the Monitoring and Advisory Service takes over in a set-it-and-forget-it manner and my servers are now all monitored and protected.
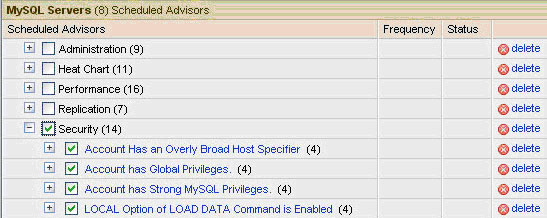
The thing I really like about this approach is that I can set up the service to protect two hundred servers as easily as I can just two servers. Using the web-based dashboard, I can create groups of servers so I can manage them in mass. I simply select a group of servers that I want to monitor, select the Advisors and rules I want to enforce against that group, select a schedule that determines the frequency with which the Advisors run and poll each server, and I’m done.

Figure 2 – Selecting the Security Advisor to run against selected MySQL servers
Changing or altering a standing monitoring schedule is easy too. In the end, the automated approach that the Monitoring and Advisory Service offers is one that lets me focus on important things other than worrying if a particular server has an issue I need to deal with. Which leads me to the next thing I like about the Monitoring and Advisory Service…
Where do I need to spend my Time?
When I walked in every morning to my DBA job, there was one major question that needed to be answered: Is there anything that immediately requires my attention? Maybe a database server is down or a server is experiencing a major slowdown that’s about to impact a key application. The problem was, I had lots of servers that were my responsibility so visiting each one individually could take up the entire morning.
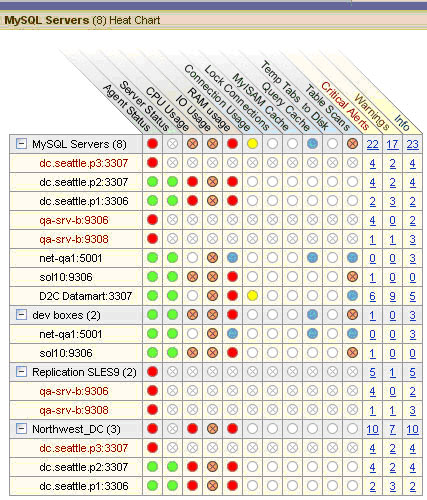
I really like the fact that the Monitoring and Advisory Service takes the guesswork out of answering the question above. It does this through a smart “Heat Chart” (see Figure 3) that is displayed on the Enterprise Dashboard that provides an at-a-glance method for determining if any MySQL servers are experiencing an outage or performance issues. The Heat Chart lets me instantly know where I need to focus my time and attention in regard to the MySQL servers I manage. The first two columns of the Heat Chart show the up/down status of each agent that is monitoring a server as well as the server status. This means you will immediately know if you have any down production systems.
The Heat Chart also supplies key indicators for the most common performance diagnostics for a server (CPU, I/O, RAM usage) and the MySQL Instance(s) on that server. The colorized indicators on the Heat Chart let you know if something is out of line for a variety of statistics, plus the Heat Chart also supplies a count of all key alerts that have been issued for a server. You can easily drill down to find out all the alerts for a server or group of servers and learn what is actually happening behind the scenes.

Figure 3 – A Sample Heat Chart from the Enterprise Dashboard
The Heat Chart will drastically reduce the time it takes for you to understand the state of your servers and will be a big help in determining where you need to focus your time and attention.
Monitoring by Exception plus Expert Help
Although the Enterprise Dashboard of the Monitoring and Advisory Service provides excellent visual insight into the exceptions that have occurred in your monitored servers, many DBAs will appreciate the “headless” nature of the service. A lot of DBAs prefer to monitor by exception, which translates into being notified only if a critical need has arisen on a production server. This is very easy to do with the Monitoring and Advisory service through its notification mechanisms.
You can have the service send you an email notification when a critical issue has been detected so you don’t have to manually check the Enterprise Dashboard to see if any problems have occurred on your servers. You can also set up notification groups within the service so various DBAs receive notifications only for the servers they are responsible for. Currently the service supports SMTP notifications, but other notification methods (SNMP, RSS, etc.) are coming soon.
When a notification is sent, it contains a detailed explanation of the identified problem along with all relevant statistics. One thing particularly important to note is that, in addition to pointing out a particular issue, the Monitoring and Advisory Service also supplies expert advice on how to go about fixing the problem (even including the commands needed if applicable). This is a great feature for those new to MySQL because novice DBAs are often in the dark about how to go about making things right on a server. In addition, links to further reading on the topic are supplied through the Monitoring and Advisory service so you can bone up on the particular problem area. Links to the expert-written online Knowledge Base, the MySQL Manual, and more are provided.
Conclusion
The key to success in many active database environments is smartly automating tasks that can otherwise consume a large amount of your time. Given that recent polls indicate a DBA spends nearly 30% or more of their time troubleshooting their database systems, you can see why it’s wise to find ways to automate the enforcement of standards that keep your database servers up and running well.
The MySQL Enterprise Monitoring and Advisory Service has been designed to automatically track the health of your MySQL servers around-the-clock and take the guesswork out of understanding where you need to focus your time and attention. I really like the ease with which this can all be accomplished and appreciate the fact that the service is every bit as effective for a hundred servers as it is for just a handful.
For more information on the Monitoring and Advisory Service, please visit the MySQL website at http://www.mysql.com/products/enterprise/advisors.html where white papers, demo’s and more are available. And if you’d like to try out the Monitoring and Advisory Service for yourself, please contact a MySQL Account Manager.
Thanks, as always, for supporting MySQL!

