About the Authors
Scott Sanders, Software Architect
A life-long entrepreneur and software developer/architect with 13 years of experience in enterprise software development. Scott is an active member of the open source community for the past 7 years holding positions as an Apache Software Foundation Member and Project Management Committee Member of the Apache Gump and Apache Jakarta Commons projects. Scott is also a Member of the Apache Foundation Infrastructure Team responsible for the management and day-to-day system administration and operation of the various hardware that runs the Apache services.
Teodor Danciu,
Founder and Architect JasperReports
JasperSoft Corporation
Teodor Danciu started JasperReports in 2001 and has been its Architect and Lead Developer. Teodor has over 10 years experience as a software engineer working on ERP, B2B, B2C and other database related applications. He has been working with Java for many years and has successfully led development teams on numerous J2EE projects. For the last 3 years he's being working with Hibernate, SWT and the Avalon Framework for porting a large ERP system to the Java Platform.
Creating a DBA Dashboard for MySQL
Introduction
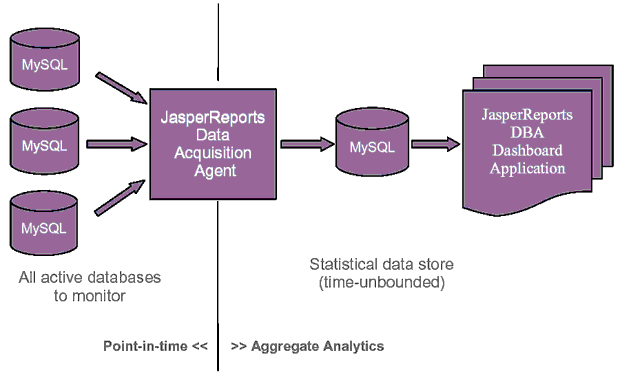
MySQL provides access to great status information for nearly everything. However, this status information can be difficult to view over time, as MySQL only gives point-in-time status information representative of that instant the status request was made. In addition, monitoring several MySQL servers requires separate status requests for each one.
JasperReports DBA Dashboard Application for MySQL solves these problems by automated monitoring and statistical data collection about all the MySQL Servers in your environment. JasperReports DBA Dashboard Application for MySQL is open source and can be downloaded free of charge from SourceForge at http://jasperreports.sourceforge.net/.

What it does
JasperReports DBA Dashboard Application for MySQL acquires useful MySQL status information over time (intervals set by the developer), so that analysis can be performed to help in understanding your MySQL server(s) needs. Information such as server health, schema information, database size, and usage statistics are aggregated on a periodic basis to give you insight into your MySQL databases. JasperReports answers questions such as: How many queries per day? Which user has the most resource usage? What tables are growing the fastest?

By acquiring status information from every MySQL server in your environment, you can watch all of them over time, with very little overhead to the servers themselves. In fact, the DBA Dashboard Polling Agent is easily capable of monitoring 500+ servers and thousands of databases simultaneously.
Supported Versions of MySQL
MySQL versions 3.x, 4.x, and 5.x are currently supported. JasperReports DBA Dashboard Application for MySQL auto-detects the MySQL server version and customizes the data acquisition agent accordingly. A single installation of the JasperReports DBA Dashboard Application can be used to monitor multiple versions of MySQL servers simultaneously.
Technical Details
All of the data collected by the JasperReports DBA Dashboard Application is available real-time in the MySQL Administrator interface that ships with MySQL. Following is the technical process list of the MySQL Administrator commands:
JasperReports DBA Dashboard Application for MySQL processes four types of status by default, on a per server basis:
- SHOW STATUS – recommended to run once per second, stores data in status, and captures bytes in, bytes out, select queries, insert queries, connections (all within the last acquisition period), and total uptime (seconds). Useful for profiling usage statistics of tables and databases.
- SHOW PROCESSLIST - recommended to once per minute, stores data in process_list, and captures point-in-time data of which users are connected to which servers/databases. Useful for determining which users are most/least active on the database.
- SHOW TABLE STATUS - recommended to run once per day, stores data in table_status, and shows storage information including table creation time, number of rows, average row length, data length, index length, update time and check time for every database and table that the data acquisition user is allowed to check. Useful for monitoring areas of greatest table growth.
- USE INFORMATION_SCHEMA - recommended to run once per day, stores data from the information_schema database to the statistical data acquisition database, and captures schema information such as columns, column privileges, key column usage, routines, schema privileges, table constraints, table privileges, user privileges and views for each of the databases. Useful for questions such as "What does user xyz have access to?" or "Who has access to table abc?" or "Where is table.column used in the database?” (Answer: view x, stored procedure y, trigger z). Valid only for MySQL version 5.0 or greater.
How To Download
JasperReports DBA Dashboard Application for MySQL is open source and can be downloaded free of charge from SourceForge at http://jasperreports.sourceforge.net/. It can be installed on a separate server or directly on a MySQL server. JasperReports DBA Dashboard Application is a Java 1.4 application and therefore needs a JVM on the installed server for it to run. For installation instructions, follow the README.txt in the distribution.
Configuration
The JasperReports DBA Dashboard Application for MySQL is easy to configure with a simple XML-based file.
<config>
  <destination>
    <name>somedbname</name>
    <login>somelogin</login>
    <pass>somepass</pass>
    <url>jdbc:mysql://somehost/somedbname</url>
  </destination>

  <source>
    <name>somedbname</name>
    <login>somelogin</login>
    <pass>somepass</pass>
    <url>jdbc:mysql://somehost/somedbname</url>
    <status period="somenumber"/>
    <tableStatus period="somenumber"/>
   <processList period="somenumber"/>
   <informationSchema period="somenumber"/>
  </source>
</config>
There is one ‘destination’ element per installation which defines the data store for the DBA Dashboard Polling Agent. When setting up the DBA Dashboard Application for the first time, you must create this database (defined in the ‘name’ element) before running the Polling Agent. In turn, the Polling Agent will create all the tables that are necessary to store the retrieved data. The login and password (defined in the ‘login’ and ‘pass’ elements) must correlate with a user on the statistical data store that has create, insert and select privileges.
There is one ‘source’ element for each MySQL server that is to be monitored. The ‘name’ element is a friendly name that describes the database or server to be monitored. The login and password (defined in the ‘login’ and ‘pass’ elements) must correlate with a user on the server to be monitored that has select privileges on all databases that you want to observe. In the case that there is not one single user (login/password combination) that can see all databases to be monitored, create multiple ‘source’ elements for each user that has a window into the server. The ‘url’ element defines the server and a database name to connect to for monitoring; the database must exist before creating the connection. The Polling Agent will automatically monitor all MySQL databases it has privileges to see on the specified server (even though only one database is given in the url). The elements ‘status’, ‘tableStatus’, ‘processList’, and ‘informationSchema’ describe the frequency (defined in milliseconds) at which the Polling Agent will run for the respective process. It is recommended that status is run at 1000 (every second), tableStatus is run at 86400000 (once a day), processList is run at 60000 (every minute), and informationSchema is run at 86400000 (once a day).
For more information, read the configure.xml.sample file in the distribution.
Web Application User Interface
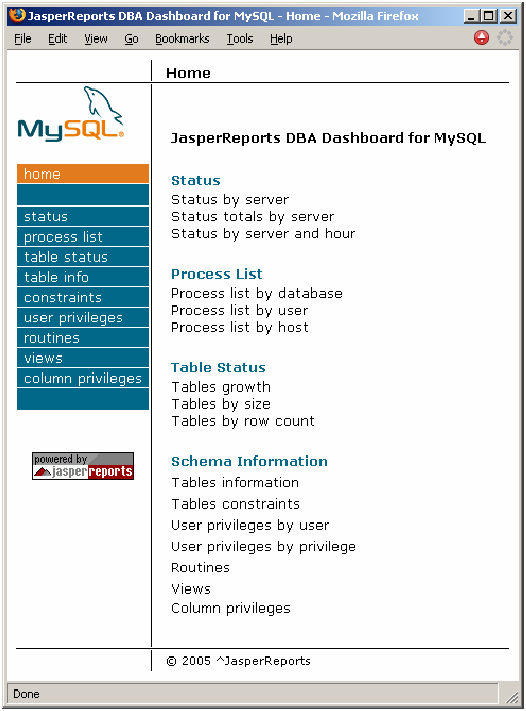
The Dashboard Web interface presents all the data collected by the Agent, in the following reports:
- Server status – shows reports about the total amount of traffic, select and insert commands, number of opened connections throughout the given interval. It also shows charts with the same data, for a more intuitive view of the server status.
- Process list – shows reports about opened processes by user, database or host throughout the given interval
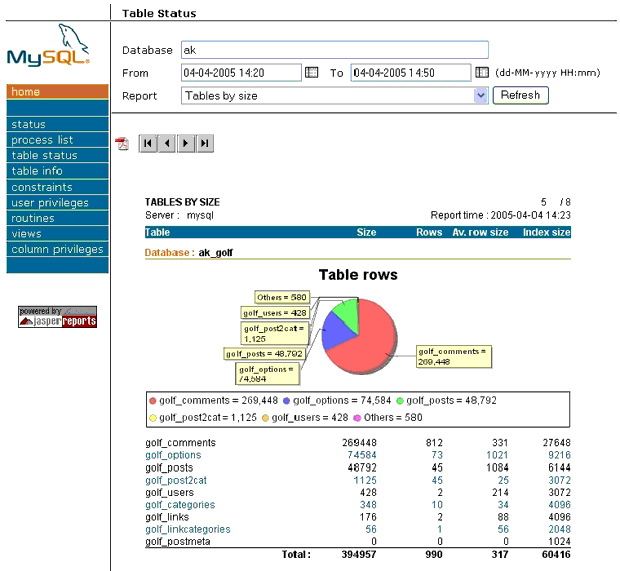
- Table status – shows a report about table metrics and dynamics, such as table sizes and table growth throughout the given interval. It also shows relevant charts concerning table sizes.
- Information schema – available only for MySQL
5.0 or later. It shows lots of server related information
that can be obtained by querying the INFORMATION_SCHEMA database. The web
application currently contains the following reports:
- Table information – used to get information about table structure
- Constraints – lists constraints of all tables in a certain database
- User privileges – lists global user privileges
- Routines – lists all stored procedures and functions on a certain host
- Views – lists all views on a certain host
- Column privileges – lists all column privileges on a certain database. This report only lists privileges that are specifically granted on column level(even if an user has additional privileges at table level, they are not displayed unless they are explicitly assigned on column level)

All reports can be exported to PDF for offline browsing and printing. Also, all reports can be viewed page by page inside the web interface, rather than having the entire report in one gigantic HTML page. When a report generation is requested, the filled report is stored in memory and is displayed page by page, using a pagination system. This ensures that the time consuming filling process is only done once, thus the viewer will only have to retrieve the current page from the cached object (by using the JasperReports single page retrieval facility).
Before actually creating the report, the engine checks the row count and warns the user if the report might be too large. Each report template contains an alternate query (defined as a report property) that counts the number of records that the actual report query would return. If the row count is too big, the user is warned that the requested report might take a long time to be generated.
The application was written using the Jakarta Struts framework. Basically, every report has its own Struts action, where all the business logic is found. But, although different, all the actions have approximately the same flow, as follows: retrieve the user criteria, check user input (if necessary), execute the row count checking query found in the report template, fill the report (or if the row count is too big, display a warning) and store it to memory, display the first page. All actions also handle page-by-page navigation.

