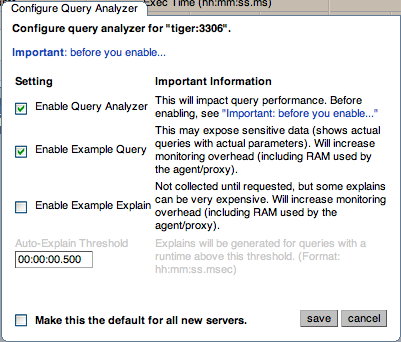
There are a number of settings related to the Query Analyzer data. You can configure the query analyzer operation by using the configure query analyzer link within the Query Analyzer tab, or through the configure query analyzer button within the Manage Servers tab within the Settings tab. Both methods provide you with the same dialog:
Through either solution, the configuration options that you select are applied to the individual server or server group selected within the Serversnavigation panel.
There are three configuration options available through either method:
-
Enable Query Analyzer configures whether query analyzer should be enabled for this server or server group. If selected, query analyzer will be enabled. To disable, delect the check box.
If Query Analyzer has been enabled, then you can additional configure the Example Query function by selecting the Enable Example Query checkbox. Enabling this option provides an additional tab when you open the Canonical Query window when clicking on a query.
-
Enable Example Query allows the Query Analyzer to display more information about individual queries. When enabled, queries and their data items (rather than the canonical form shown by default) will be provided. Enabling this option may expose the full query statements and therefore may present a security issue.
With the Example Query option enabled, an additional tab within the query summary details is made available. For more information, see Section 9.2, “Getting Detailed Query Information”.
If you have enabled Example Query, then you can additional enable Example Explain, To enable this tab, select the Enable Example Explain checkbox.
-
Enable Example Explain provides another tab when viewing a query where you can view the output from
EXPLAINoutput from MySQL for the selected query. This will show the full query and how the query was executed within the servers.When the
EXPLAINfunctionality has been enabled, the Auto-Explain Threshold controls when theEXPLAINoutput for a query is triggered. Queries that take longer than the Auto-Explain Threshold will have theEXPLAINoutput generated and stored in the database to be display in the Example Explain tab.Enabling this option may add additional overhead to the execution of your server, as the server will run an
EXPLAINstatement each time it identifies a long running query. For more information, Appendix A, MySQL Enterprise Monitor Frequently Asked Questions.
To enable or disable query analyzer for an individual server, go to the Settings page and click on the Manage Servers link. To configure all the properties, click the configure query analyzer link next to server you want modify.
Alternatively, for each server, the Query Analyzer column shows the current setting, On or Off, and whether the Example and Explain functionality is enabled. To change any setting, click on the current status to toggle between the On/Off position.
To disable or enable Query Analyzer for the selected servers, use
the disable query analyzer or
enable query analyzer buttons within the
Settings page. You must have selected one or
more servers from the list of available servers before selecting
these buttons.
You can use the options that you have just selected as the default for all new servers that register with MySQL Enterprise Service Manager by using select the Make this the default for all new servers checkbox. By default, when a new server registers with MySQL Monitor, the server is automatically configured to supply Query Analyzer data. This can have impact on the performance of your monitor and agent as it increases the amount of information supplied to the MySQL Monitor.
Configuration of Query Analyzer occurs through the configure defaults button from within the Query Analyzer page.

