![]()

![]()
To make it easy to visualize, wrangle, and feature engineer time series data for forecasting and machine learning prediction.
Full Time Series Machine Learning and Feature Engineering Tutorial: Showcases the (NEW) step_timeseries_signature() for building 200+ time series features using parsnip, recipes, and workflows.
Visit the timetk website documentation for tutorials and a complete list of function references.
Investigate a time series…
taylor_30_min %>%
    plot_time_series(date, value, .color_var = week(date),
                     .interactive = FALSE, .color_lab = "Week")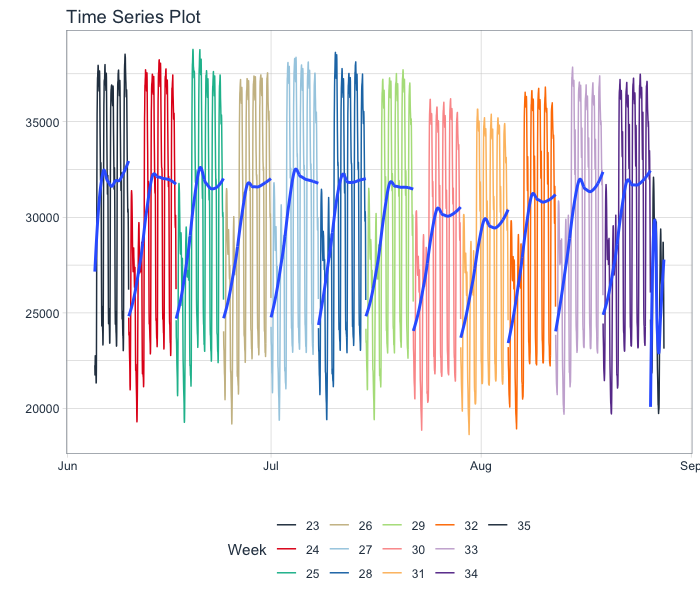
Visualize anomalies…
walmart_sales_weekly %>%
    group_by(Store, Dept) %>%
    plot_anomaly_diagnostics(Date, Weekly_Sales,
                             .facet_ncol = 3, .interactive = FALSE)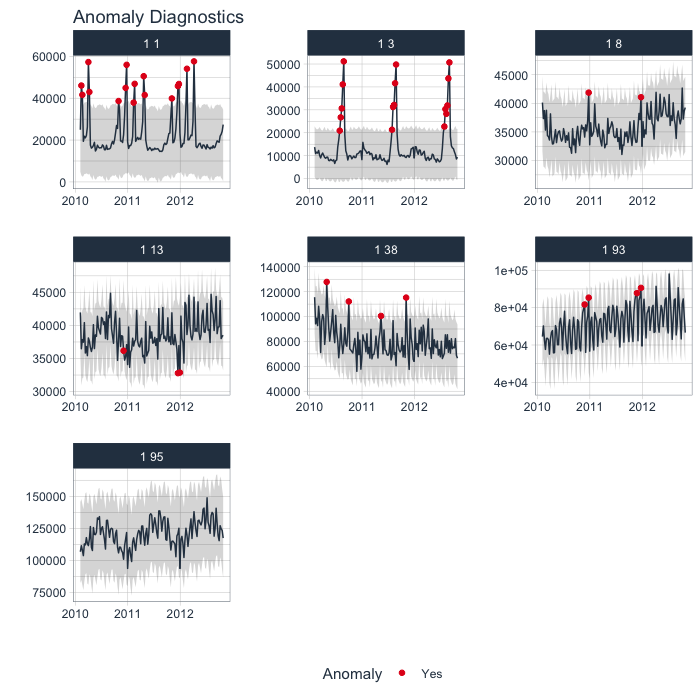
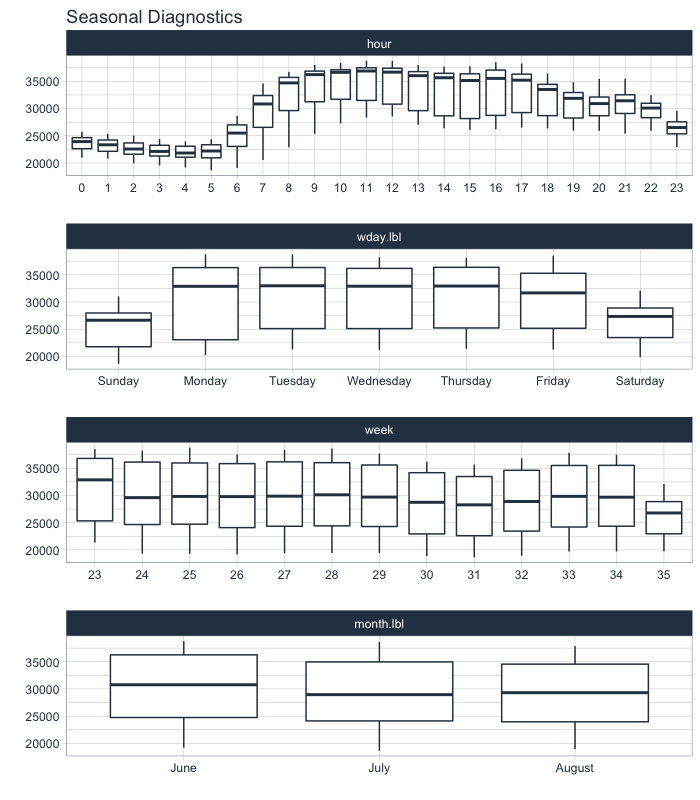
Make a seasonality plot…
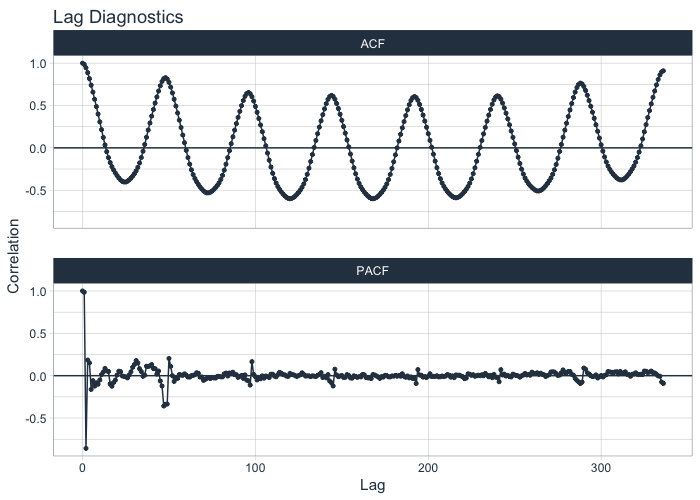
Inspect autocorrelation, partial autocorrelation (and cross correlations too)…
What are you waiting for? Download the development version with latest features:
Or, download CRAN approved version:
The timetk package wouldn’t be possible without other amazing time series packages.
timetk function that uses a period (frequency) argument owes it to ts().
plot_acf_diagnostics(): Leverages stats::acf(), stats::pacf() & stats::ccf()plot_stl_diagnostics(): Leverages stats::stl()timetk makes heavy use of floor_date(), ceiling_date(), and duration() for “time-based phrases”.
%+time% & %-time%): "2012-01-01" %+time% "1 month 4 days" uses lubridate to intelligently offset the dayts, and it’s predecessor is the tidyverts (fable, tsibble, feasts, and fabletools).
ts_impute_vec() function for low-level vectorized imputation using STL + Linear Interpolation uses na.interp() under the hood.ts_clean_vec() function for low-level vectorized imputation using STL + Linear Interpolation uses tsclean() under the hood.auto_lambda() uses BoxCox.Lambda().timetk does not import tibbletime, it uses much of the innovative functionality to interpret time-based phrases:
tk_make_timeseries() - Extends seq.Date() and seq.POSIXt() using a simple phase like “2012-02” to populate the entire time series from start to finish in February 2012.filter_by_time(), between_time() - Uses innovative endpoint detection from phrases like “2012”slidify() is basically rollify() using slider (see below).purrr-syntax for complex rolling (sliding) calculations.
slidify() uses slider::pslide under the hood.slidify_vec() uses slider::slide_vec() for simple vectorized rolls (slides).pad_by_time() function is a wrapper for padr::pad().step_ts_pad() to apply padding as a preprocessing recipe!ts system, which is the same system the forecast R package uses. A ton of inspiration for visuals came from using TSstudio.If you are interested in learning from my advanced Time Series Analysis & Forecasting Course, then join my waitlist. The course is coming soon.
You will learn: