![]()

![]()
![]()
![]()
![]()
Use this R package to download, navigate and analyse the Student-Life dataset. The Student-Life dataset contains passive and automatic sensing data from the phones of a class of 48 de-identified Dartmouth college students. It was collected over a 10 week term. Additionally, the dataset contains Ecological Momentary Assessment results along with pre- and post-study mental health surveys, such as the PHQ-9. The intended use is to assess mental health, academic performance and behavioral trends. The raw dataset and additional information is available at https://studentlife.cs.dartmouth.edu/.
## Uncomment to install the package
# install.packages("devtools")
# devtools::install_github("frycast/studentlife")
Details on the dataset are available here. Once installed, you can download and extract the data within R:
Then you can use the interactive menu to browse the tables and schemas:
The object returned by the above function is called a ‘StudentLife tibble’ (or SL_tbl). Restrictions can be placed on the menu options with time_options:
tab_t <- load_SL_tibble(location = d, time_options = "timestamp", csv_nrows = 10)
tab_p <- load_SL_tibble(location = d, time_options = "interval" , csv_nrows = 10)
tab_d <- load_SL_tibble(location = d, time_options = "dateonly" , csv_nrows = 10)
tab_s <- load_SL_tibble(location = d, time_options = "dateless" , csv_nrows = 10)
The regularise_time function can be used to summarise information within blocks of time, producing an object called a ‘regularised StudentLife tibble’ (or reg_SL_tbl):
tab <- load_SL_tibble(
  loc = d, schema = "sensing", table = "activity", csv_nrows = 10)

regularise_time(
  tab, blocks = c("day","weekday"),
  act_inf = max(activity_inference), add_NAs = FALSE)
Produce a histogram showing PAM EMA response frequencies over the course of the study:
tab_PAM <- load_SL_tibble(schema = "EMA", table = "PAM", location = d)
response_hour_hist(tab_PAM, break_hours = 10)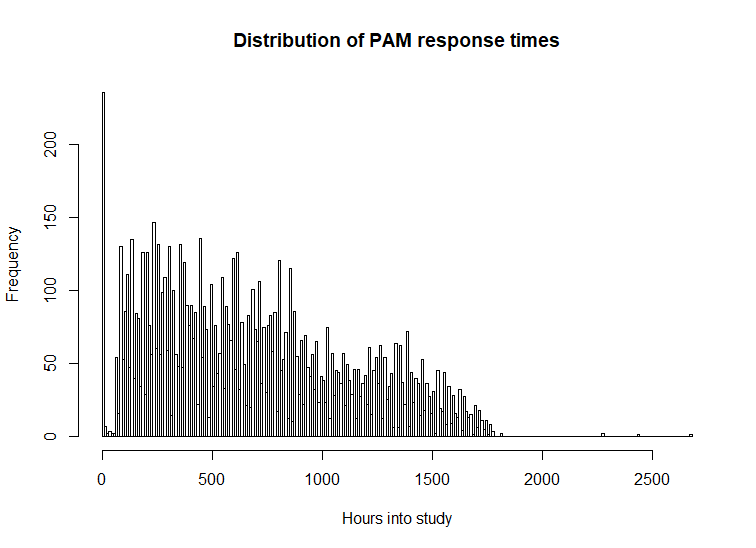
A summary will produce details such as EMA question, UIDs of dropped students, schema name, table name, and summary statistics.
EMA_questions
 Refer to: Pollak, J. P., Adams, P., & Gay, G. (2011, May).
 PAM: a photographic affect meter for frequent, in situ measurement of affect.
 In Proceedings of the SIGCHI conference on Human factors in computing systems
 (pp. 725-734). ACM.

dropped_students
 None

column_names
 picture_idx timestamp uid

schema
 EMA

table
 PAM

Skim summary statistics
 n obs: 9040
 n variables: 3

-- Variable type:factor --------------------------------------------------------
 variable missing complete    n n_unique                        top_counts ordered
      uid       0     9040 9040       49 59: 437, 0: 390, 19: 384, 57: 377   FALSE

-- Variable type:numeric -------------------------------------------------------
    variable missing complete    n    mean         sd      p0     p25     p50      p75     p100
 picture_idx       0     9040 9040 8.85          4.17 1       6       8       12       16
   timestamp       0     9040 9040 1.4e+09 1608614.45 1.4e+09 1.4e+09 1.4e+09  1.4e+09  1.4e+09
     hist
 ▂▃▆▇▃▆▅▅
 ▇▇▆▅▃▁▁▁
After regularising a StudentLife tibble, we can visualise the missing values in each block for each student:
reg_PAM <- regularise_time(tab_PAM, blocks = c("day", "epoch"), m = mean(picture_idx, na.rm = TRUE))
vis_NAs(reg_PAM, response = "m")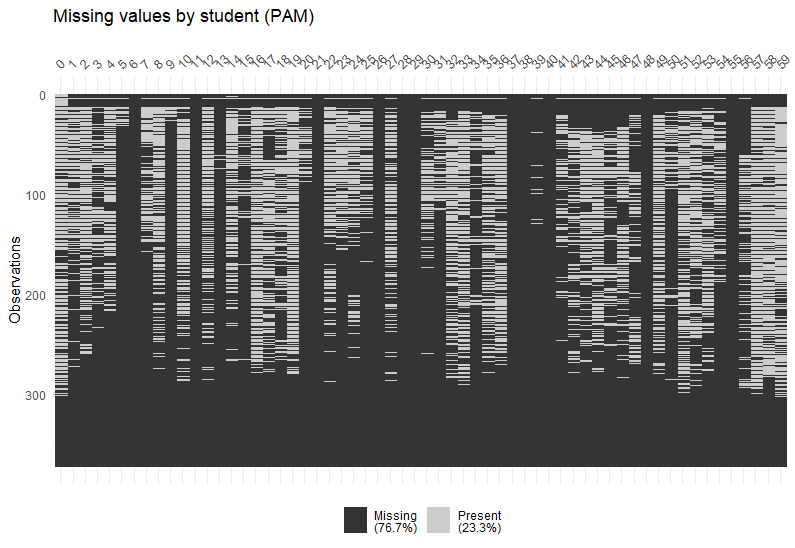
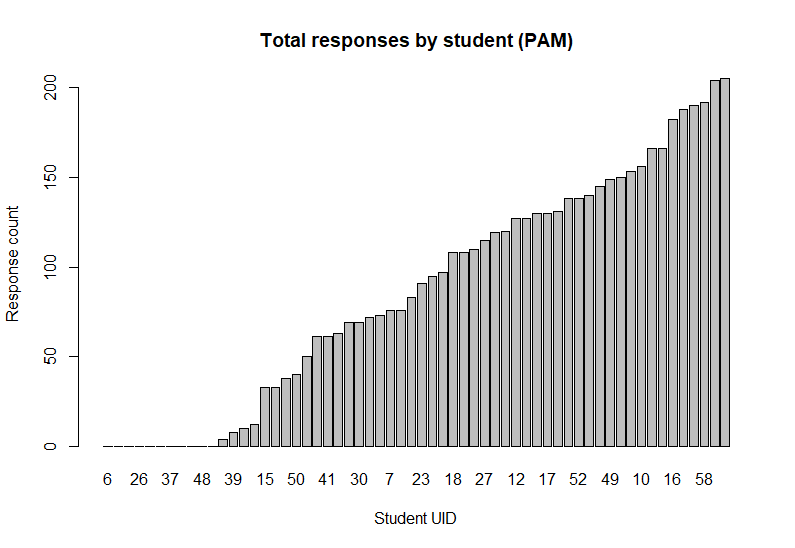
We can also visualise and compare the total number of responses received from each student over the course of the study:
Summaries of survey data are formatted with question information and some answer statistics:
time_info
 none

survey_questions
 Q1: Little interest or pleasure in doing things
 Q2: Feeling down, depressed, hopeless.
 Q3: Trouble falling or staying asleep, or sleeping too much.
 Q4: Feeling tired or having little energy
 Q5: Poor appetite or overeating
 Q6: Feeling bad about yourself or that you are a failure or have let yourself or your family down
 Q7: Trouble concentrating on things, such as reading the newspaper or watching television
 Q8: Moving or speaking so slowly that other people could have noticed. Or the opposite being so figety or restless that you have been moving around a lot more than usual
 Q9: Thoughts that you would be better off dead, or of hurting yourself
 Q10: Response


column_names
 uid type Q1 Q2 Q3 Q4 Q5 Q6 Q7 Q8 Q9 Q10

schema
 survey

table
 PHQ-9

skim
Skim summary statistics
 n obs: 84
 n variables: 12

-- Variable type:factor --------------------------------------------------------
 variable missing complete  n n_unique                        top_counts ordered
       Q1       0       84 84        4 Not: 42, Sev: 28, Mor: 10, Nea: 4   FALSE
      Q10       5       79 84        4   Som: 37, Not: 36, NA: 5, Ext: 3   FALSE
       Q2       0       84 84        4  Not: 40, Sev: 34, Mor: 6, Nea: 4   FALSE
       Q3       0       84 84        4 Not: 41, Sev: 25, Mor: 10, Nea: 8   FALSE
       Q4       0       84 84        4 Sev: 38, Not: 23, Mor: 17, Nea: 6   FALSE
       Q5       0       84 84        4  Sev: 35, Not: 34, Mor: 9, Nea: 6   FALSE
       Q6       0       84 84        4  Not: 45, Sev: 27, Mor: 6, Nea: 6   FALSE
       Q7       0       84 84        4  Not: 48, Sev: 26, Mor: 7, Nea: 3   FALSE
       Q8       0       84 84        4  Not: 64, Sev: 15, Mor: 4, Nea: 1   FALSE
       Q9       0       84 84        3    Not: 75, Sev: 6, Mor: 3, NA: 0   FALSE
     type       0       84 84        2           pre: 46, pos: 38, NA: 0   FALSE
      uid       0       84 84       46            0: 2, 1: 2, 2: 2, 3: 2   FALSE