Record everything (almost) that happens in a ‘Shiny’ application browser side. Powered by localForage.
![]()
Install from CRAN with :
Or install dev version from GitHub:
Call track_usage in your server function, it will record:
New inputs are created to expose those data, you can access them with .shinylogs_input, .shinylogs_error, .shinylogs_output and .shinylogs_browserData. An additional input is also created to expose the last input modified by the user: .shinylogs_lastInput.
When application is closed (in fact on session ended), a JSON is created in a subfolder of app’s directory.
Example:
# Shiny server
function(input, output, session) {

  track_usage(storage_mode = store_json(path = "logs/"))

}
Example of JSON created (with the Kmeans example app)
{
"inputs":[
{
"name":"ycol",
"timestamp":"2019-04-07T13:39:40+02:00",
"value":"Sepal.Width",
"type":"",
"binding":"shiny.selectInput"
},
{
"name":"ycol",
"timestamp":"2019-04-07T13:39:35+02:00",
"value":"Petal.Width",
"type":"",
"binding":"shiny.selectInput"
},
{
"name":"clusters",
"timestamp":"2019-04-07T13:39:37+02:00",
"value":5,
"type":"shiny.number",
"binding":"shiny.numberInput"
},
{
"name":"xcol",
"timestamp":"2019-04-07T13:39:33+02:00",
"value":"Sepal.Length",
"type":"",
"binding":"shiny.selectInput"
},
{
"name":"clusters",
"timestamp":"2019-04-07T13:39:37+02:00",
"value":4,
"type":"shiny.number",
"binding":"shiny.numberInput"
},
{
"name":"ycol",
"timestamp":"2019-04-07T13:39:38+02:00",
"value":"Species",
"type":"",
"binding":"shiny.selectInput"
},
{
"name":"clusters",
"timestamp":"2019-04-07T13:39:37+02:00",
"value":5,
"type":"shiny.number",
"binding":"shiny.numberInput"
},
{
"name":"xcol",
"timestamp":"2019-04-07T13:39:32+02:00",
"value":"Sepal.Width",
"type":"",
"binding":"shiny.selectInput"
}
],
"errors":[
{
"name":"plot1",
"timestamp":"2019-04-07T13:39:39+02:00",
"error":"NA/NaN/Inf in foreign function call (arg 1)"
}
],
"outputs":[
{
"name":"plot1",
"timestamp":"2019-04-07T13:39:41+02:00",
"binding":"shiny.imageOutput"
},
{
"name":"plot1",
"timestamp":"2019-04-07T13:39:35+02:00",
"binding":"shiny.imageOutput"
},
{
"name":"plot1",
"timestamp":"2019-04-07T13:39:33+02:00",
"binding":"shiny.imageOutput"
},
{
"name":"plot1",
"timestamp":"2019-04-07T13:39:37+02:00",
"binding":"shiny.imageOutput"
},
{
"name":"plot1",
"timestamp":"2019-04-07T13:39:32+02:00",
"binding":"shiny.imageOutput"
},
{
"name":"plot1",
"timestamp":"2019-04-07T13:39:37+02:00",
"binding":"shiny.imageOutput"
}
],
"session":[
{
"app":"kmeans-example",
"user":"pvictor",
"server_connected":"2019-04-07T13:39:30+0200",
"sessionid":"e32af32f5b664b6db175aaac1e0cd70a",
"server_disconnected":"2019-04-07T13:39:42+0200",
"user_agent":"Mozilla/5.0 (Windows NT 10.0; Win64; x64) AppleWebKit/537.36 (KHTML, like Gecko) Chrome/73.0.3683.86 Safari/537.36",
"screen_res":"1920x1080",
"browser_res":"1273x909",
"pixel_ratio":1,
"browser_connected":"2019-04-07T13:39:31+02:00"
}
]
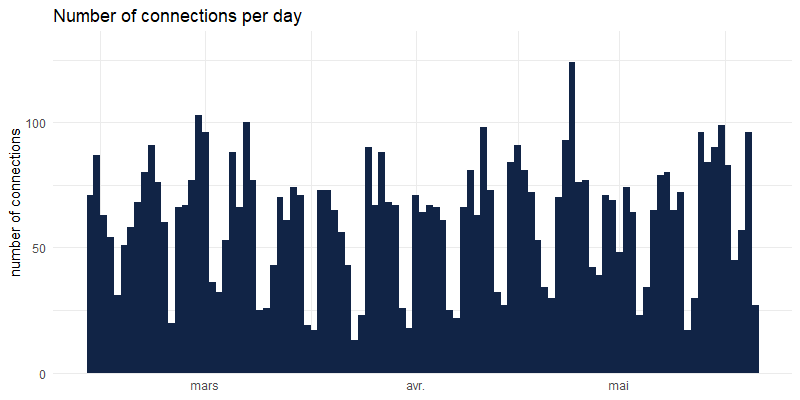
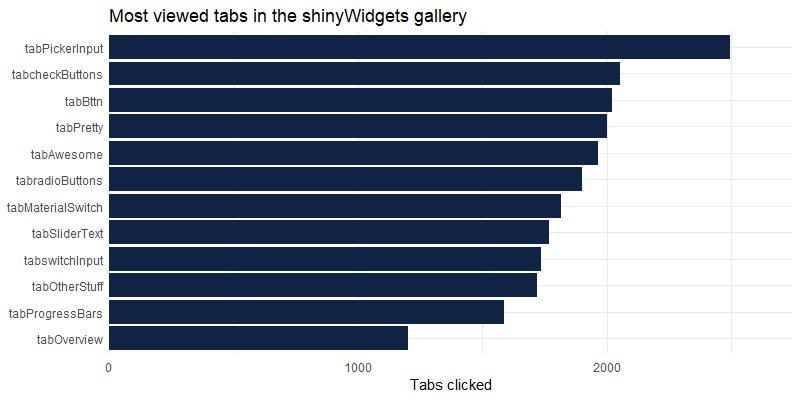
}Data recorded on our Shiny-Server available here: http://shinyapps.dreamrs.fr/
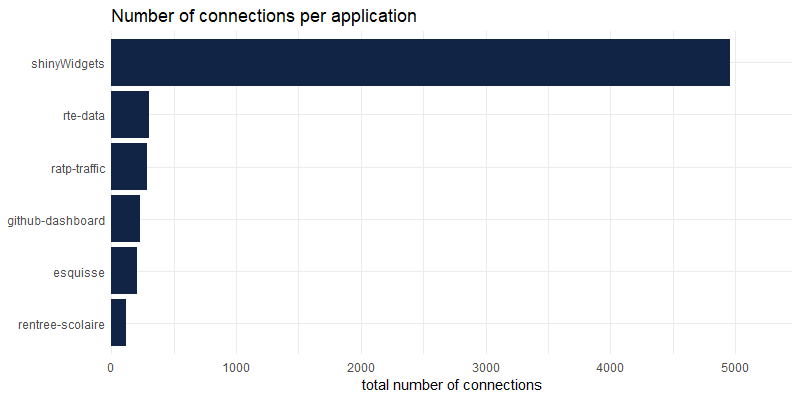
Which tabs in shinyWidgets gallery are the most seen :
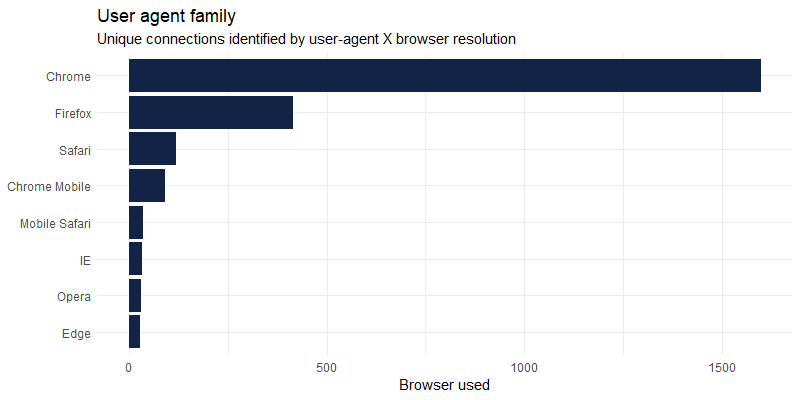
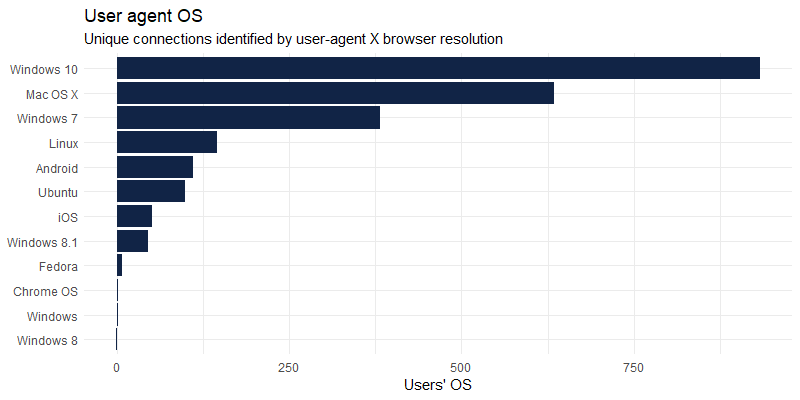
User-agent is recorded per connections and can be parsed with uaparserjs : (unique users are not registered as we use the open source version of shiny-server)