The goal of rwalkr is to provide APIs to the pedestrian data from the City of Melbourne in tidy data form.
You could install the stable version from CRAN:
You could install the development version from Github using:
There are two APIs available to access hourly Melbourne pedestrian data: compedapi and Socrata. The former drives the melb_walk() function, where counts are uploaded on a daily basis; the latter powers the melb_walk_fast() function, where counts are uploaded on a monthly basis. Given the function names, the function melb_walk_fast() pulls the data at a much faster speed than melb_walk().
The function melb_walk() specifies the starting and ending dates to be pulled, whereas melb_walk_fast() requires years to define the time frame. If a selection of sensors are of interest, melb_walk_fast() provides the flexibility for sensor choices.
library(rwalkr)
start_date <- as.Date("2017-07-01")
ped_walk <- melb_walk(from = start_date, to = start_date + 6L)
ped_walk
#> # A tibble: 10,584 x 5
#>   Sensor                     Date_Time           Date        Time Count
#>   <chr>                      <dttm>              <date>     <int> <int>
#> 1 Bourke Street Mall (North) 2017-07-01 00:00:00 2017-07-01     0   280
#> 2 Bourke Street Mall (South) 2017-07-01 00:00:00 2017-07-01     0   177
#> 3 Melbourne Central          2017-07-01 00:00:00 2017-07-01     0   826
#> 4 Town Hall (West)           2017-07-01 00:00:00 2017-07-01     0   682
#> 5 Princes Bridge             2017-07-01 00:00:00 2017-07-01     0     0
#> # … with 10,579 more rows
ped_run <- melb_walk_fast(year = 2016:2017, sensor = NULL) # NULL means all sensors
ped_run
#> # A tibble: 912,288 x 5
#>   Sensor                      Date_Time           Date        Time Count
#>   <chr>                       <dttm>              <date>     <int> <int>
#> 1 Alfred Place                2016-01-01 00:00:00 2016-01-01     0    NA
#> 2 Birrarung Marr              2016-01-01 00:00:00 2016-01-01     0  1405
#> 3 Bourke St-Russell St (West) 2016-01-01 00:00:00 2016-01-01     0  1900
#> 4 Bourke Street Mall (North)  2016-01-01 00:00:00 2016-01-01     0   461
#> 5 Bourke Street Mall (South)  2016-01-01 00:00:00 2016-01-01     0   883
#> # … with 912,283 more rows
There are missing values (i.e. NA) in the dataset. By setting na.rm = TRUE in both functions, missing values will be removed.
Here’s an example to use ggplot2 for visualisation:
library(ggplot2)
ggplot(data = subset(ped_walk, Sensor == "Melbourne Central")) +
  geom_line(aes(x = Date_Time, y = Count))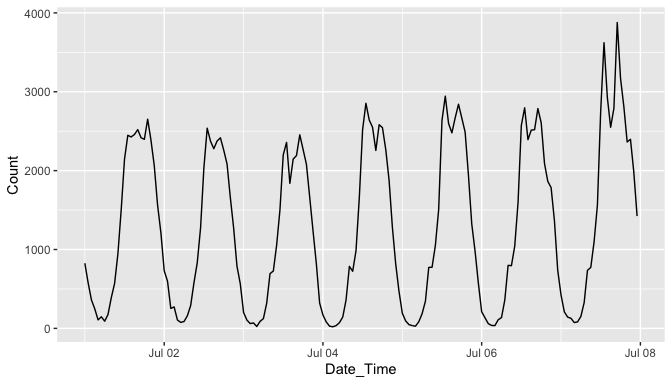
To access minute by minute directional pedestrian counts for the last hour, please check out the melb_walk_directional().
It’s recommended to include an application token in melb_walk_fast(app_token = "YOUR-APP-TOKEN"), which you can sign up here.
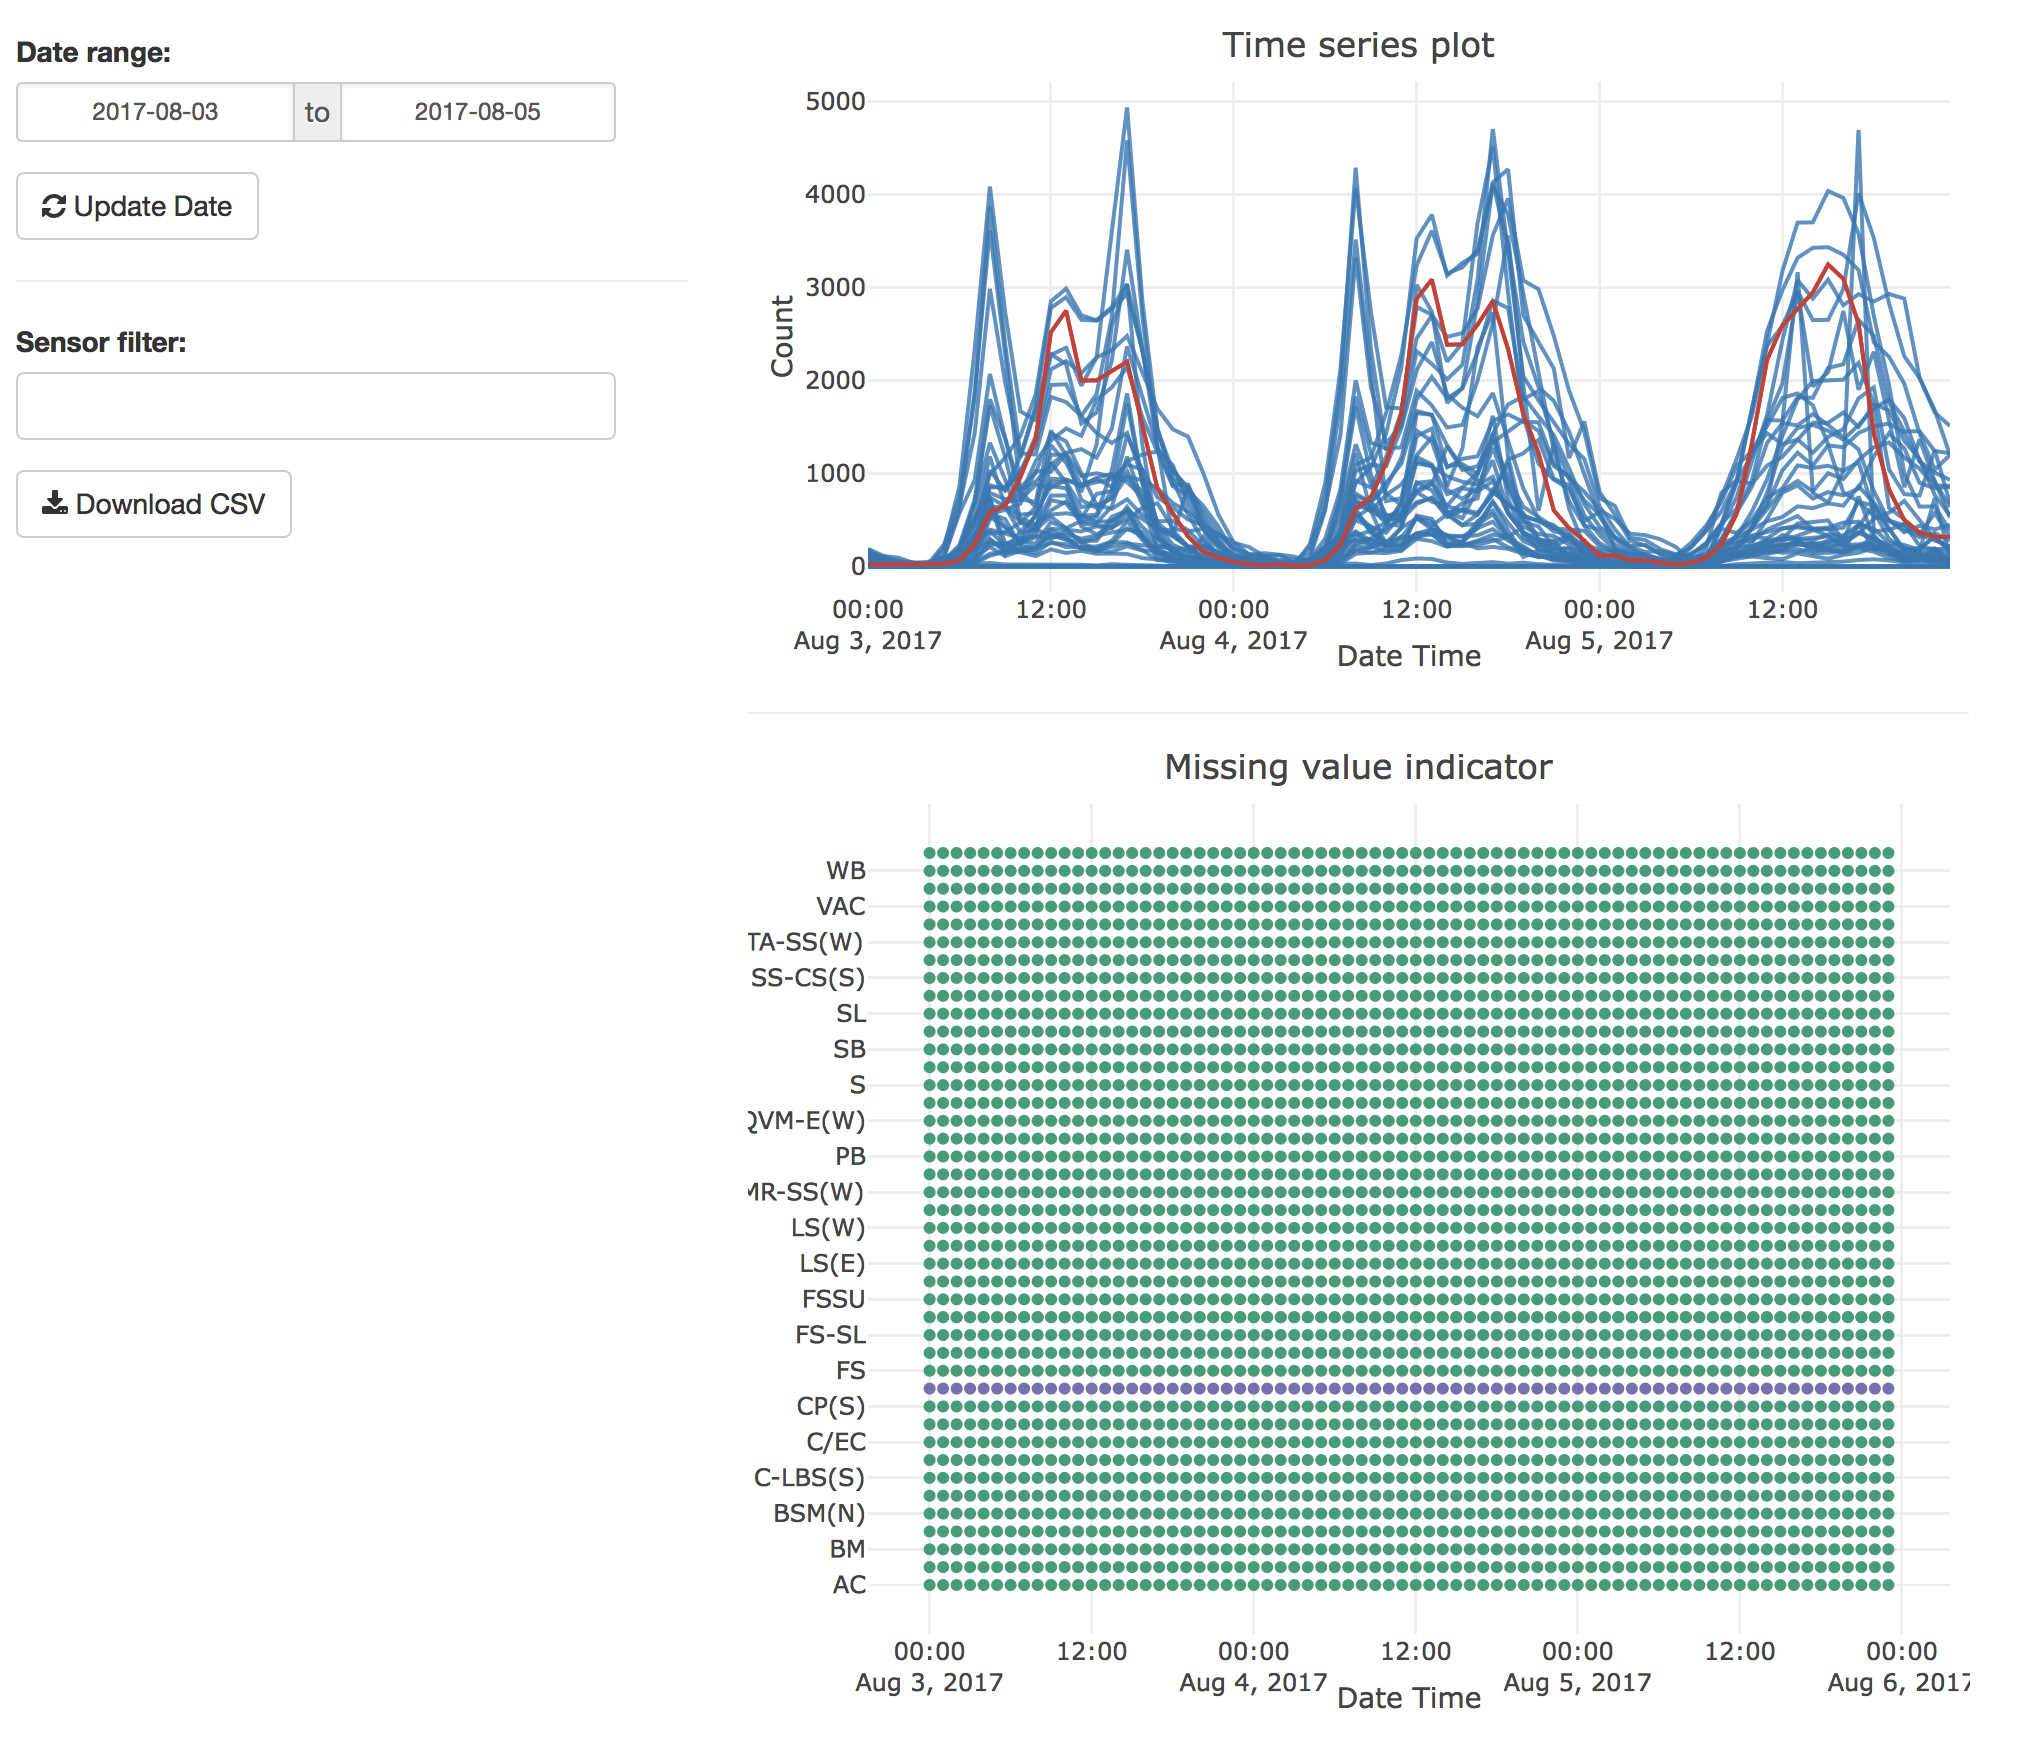
The function melb_shine() launches a shiny app to give a glimpse of the data. It provides two basic plots: one is an overlaying time series plot, and the other is a dot plot indicating missing values. Below is a screen-shot of the shiny app.