
![]()
![]()
Interactive data tables for R, based on the React Table library and made with reactR.
You can install reactable from CRAN with:
Or install the development version from GitHub with:
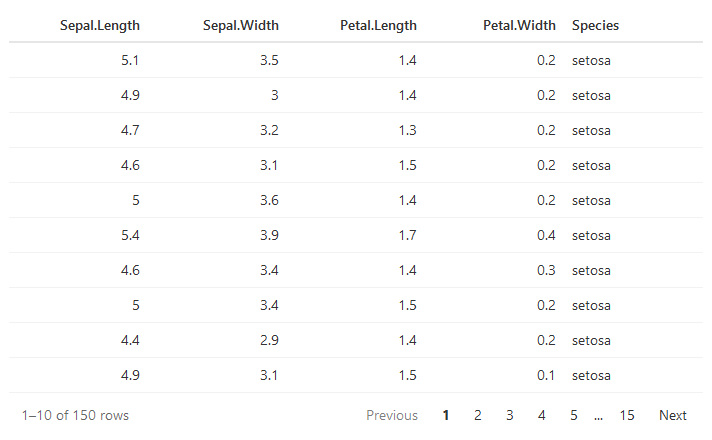
To create a table, use reactable() on a data frame or matrix:
You can embed tables in R Markdown documents:
```{r}
library(reactable)

reactable(iris)
```Or use them in Shiny applications:
library(shiny)
library(reactable)

ui <- fluidPage(
  reactableOutput("table")
)

server <- function(input, output) {
  output$table <- renderReactable({
    reactable(iris)
  })
}

shinyApp(ui, server)
To learn more about using reactable, check out the examples below.
 IE / Edge |
 Firefox |
 Chrome |
 Safari |
 Opera |
|---|---|---|---|---|
| IE11, Edge | last 2 versions | last 2 versions | last 2 versions | last 2 versions |
MIT