R client for interacting with the bioRxiv API
Install the development version from Github:
# Install package
install.packages("devtools")
devtools::install_github("nicholasmfraser/rbiorxiv")

# Load package
library(rbiorxiv)The main functions in rbiorxiv generally conform to the API endpoints outlined in the API documentation (see here).
Retrieve details of either a set of preprints deposited between two dates, or lookup a single preprint by DOI:
# Get details of preprints deposited between 2018-01-01 and 2018-01-10
# By default, only the first 100 records are returned
biorxiv_content(from = "2018-01-01", to = "2018-01-10")

# Set a limit to return more than 100 records
biorxiv_content(from = "2018-01-01", to = "2018-01-10", limit = 200)

# Or set limit as "*" to return all records
biorxiv_content(from = "2018-01-01", to = "2018-01-10", limit = "*")

# Skip the first 100 records
biorxiv_content(from = "2018-01-01", to = "2018-01-10", limit = 200, skip = 100)

# By default, data is returned in a list. Use the "format" argument to specify
# that data should be returned in "json" format or as a data frame ("df").
biorxiv_content(from = "2018-01-01", to = "2018-01-10", format = "df")

# Lookup a preprint by DOI
biorxiv_content(doi = "10.1101/833400")
The bioRxiv API currently also allows querying of details of medRxiv preprints, by supplying a “server” parameter. This can be specified as follows:
# Get details of medRxiv preprints deposited between 2020-01-01 and 2020-01-02
biorxiv_content(server = "medrxiv", from = "2020-01-01", to = "2020-01-02")
The default server parameter is always “biorxiv”. Note that the following functions documented below are limited to bioRxiv only (at the time of writing).
Retrieve details of published articles associated with bioRxiv preprints that were published between two dates:
# Get details of all articles published between 2018-01-01 and 2018-01-10
biorxiv_published(from = "2018-01-01", to = "2018-01-10", limit = "*", format = "df")Retrieve details of articles published by a specific publisher (specified by their doi prefix) between two dates:
# Get details of all articles published by eLife (prefix = 10.7554) between 2018-01-01 and 2018-01-10
biorxiv_publisher(prefix = "10.7554", from = "2018-01-01", to = "2018-01-10",
limit = "*", format = "df")Retrieve summary statistics for bioRxiv content (e.g. number of preprints deposited):
# Get summary statistics at a montly level
biorxiv_summary(interval = "m")

# Get summary statistics at a yearly level
biorxiv_summary(interval = "y")Retrieve summary statistics for usage of bioRxiv content (e.g. number of pdf downloads):
# Get usage statistics at a montly level
biorxiv_usage(interval = "m")

# Get usage statistics at a yearly level
biorxiv_usage(interval = "y")library(tidyverse)
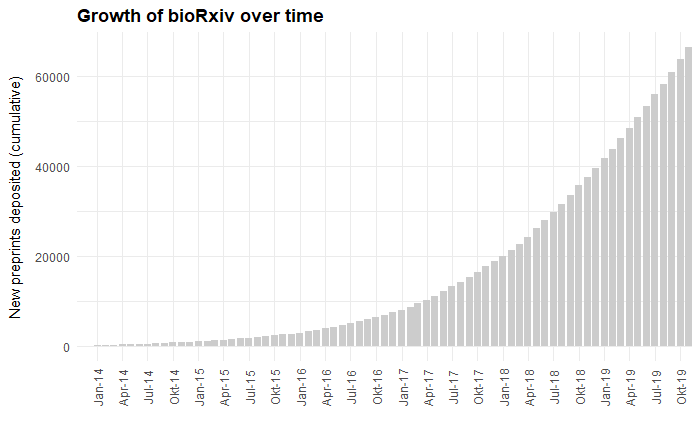
# Plot the cumulative number of new preprints deposited per month
# Note that month dates are returned in YYYY-MM format - here we convert
# month dates to YYYY-MM-DD format to make plotting easier
biorxiv_summary(interval = "m", format = "df") %>%
mutate(month = as.Date(paste0(month, "-01", format = "%Y-%m-%d"))) %>%
ggplot() +
geom_bar(aes(x = month, y = new_papers_cumulative),
fill = "#cccccc",
stat = "identity") +
labs(x = "",
y= "New preprints deposited (cumulative)",
title ="Growth of bioRxiv over time") +
scale_x_date(date_breaks = "3 months",
date_minor_breaks = "3 months",
date_labels = "%b-%y",
expand = c(0,0)) +
scale_y_continuous(labels = scales::comma) +
theme_minimal() +
theme(
axis.text.x = element_text(angle = 90, vjust = 0.5),
axis.title.y = element_text(margin = margin(t = 0, r = 10, b = 0, l = 0)),
plot.title = element_text(face = "bold")
)
library(tidyverse)
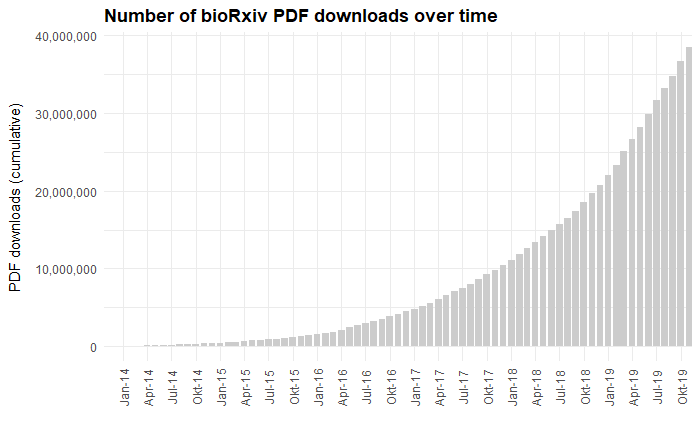
# Plot the cumulative number of PDF downloads per month
# Here month dates are returned already in YYYY-MM-DD format
biorxiv_usage(interval = "m", format = "df") %>%
mutate(month = as.Date(month)) %>%
ggplot() +
geom_bar(aes(x = month, y = pdf_cumulative),
fill = "#cccccc",
stat = "identity") +
labs(x = "",
y= "PDF downloads (cumulative)",
title ="Number of bioRxiv PDF downloads over time") +
scale_x_date(date_breaks = "3 months",
date_minor_breaks = "3 months",
date_labels = "%b-%y",
expand = c(0,0)) +
scale_y_continuous(labels = scales::comma) +
theme_minimal() +
theme(
axis.text.x = element_text(angle = 90, vjust = 0.5),
axis.title.y = element_text(margin = margin(t = 0, r = 10, b = 0, l = 0)),
plot.title = element_text(face = "bold")
)
library(tidyverse)
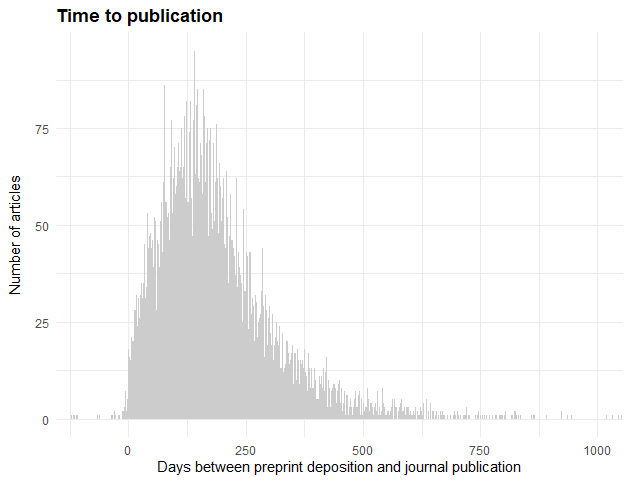
# Calculate the number of days between preprint deposition and
# journal publication. Plot results as a histogram.
biorxiv_published(from = "2013-11-01", to = "2018-12-31",
limit = "*", format = "df") %>%
mutate(days = as.Date(published_date) - as.Date(preprint_date)) %>%
ggplot() +
geom_histogram(aes(as.numeric(days)),
binwidth = 1,
fill = "#cccccc") +
labs(x = "Days between preprint deposition and journal publication",
y= "Number of articles",
title ="Time to publication") +
coord_cartesian(xlim = c(-100, 1000)) +
theme_minimal() +
theme(
axis.title.y = element_text(margin = margin(t = 0, r = 10, b = 0, l = 0)),
plot.title = element_text(face = "bold")
)
Contributors are extremely welcome! Please contribute here directly, or contact me at nicholasmfraser@gmail.com for more information.