


pairwiseComparisons: Multiple Pairwise Comparison Tests| Package | Status | Usage | GitHub | References |
|---|---|---|---|---|
|
||||
|
|
|||
|
||||
|
|
pairwiseComparisons provides a tidy data friendly way to carry out pairwise comparison tests.
It currently supports post hoc multiple pairwise comparisons tests for both between-subjects and within-subjects one-way analysis of variance designs. For both of these designs, parametric, non-parametric, robust, and Bayes Factor statistical tests are available.
To get the latest, stable CRAN release:
You can get the development version of the package from GitHub. To see what new changes (and bug fixes) have been made to the package since the last release on CRAN, you can check the detailed log of changes here: https://indrajeetpatil.github.io/pairwiseComparisons/news/index.html
If you are in hurry and want to reduce the time of installation, prefer-
# needed package to download from GitHub repo
install.packages("remotes")

# downloading the package from GitHub
remotes::install_github(
  repo = "IndrajeetPatil/pairwiseComparisons", # package path on GitHub
  dependencies = FALSE, # assumes you have already installed needed packages
  quick = TRUE # skips docs, demos, and vignettes
)
If time is not a constraint-
remotes::install_github(
  repo = "IndrajeetPatil/pairwiseComparisons", # package path on GitHub
  dependencies = TRUE, # installs packages which pairwiseComparisons depends on
  upgrade_dependencies = TRUE # updates any out of date dependencies
)Following table contains a brief summary of the currently supported pairwise comparison tests-
| Type | Equal variance? | Test | p-value adjustment? |
|---|---|---|---|
| Parametric | No | Games-Howell test | Yes |
| Parametric | Yes | Student’s t-test | Yes |
| Non-parametric | No | Dunn test | Yes |
| Robust | No | Yuen’s trimmed means test | Yes |
| Bayes Factor | NA |
Student’s t-test | NA |
| Type | Test | p-value adjustment? |
|---|---|---|
| Parametric | Student’s t-test | Yes |
| Non-parametric | Durbin-Conover test | Yes |
| Robust | Yuen’s trimmed means test | Yes |
| Bayes Factor | Student’s t-test | NA |
Here we will see specific examples of how to use this function for different types of
# for reproducibility
set.seed(123)
library(pairwiseComparisons)

# parametric
# if `var.equal = TRUE`, then Student's *t*-test will be run
pairwise_comparisons(
  data = ggplot2::msleep,
  x = vore,
  y = brainwt,
  type = "parametric",
  var.equal = TRUE,
  paired = FALSE,
  p.adjust.method = "bonferroni"
)
#> # A tibble: 6 x 8
#>   group1  group2  mean.difference p.value significance
#>   <chr>   <chr>             <dbl>   <dbl> <chr>
#> 1 carni   herbi            0.542    1     ns
#> 2 carni   insecti         -0.0577   1     ns
#> 3 carni   omni             0.0665   1     ns
#> 4 herbi   insecti         -0.600    1     ns
#> 5 herbi   omni            -0.476    0.979 ns
#> 6 insecti omni             0.124    1     ns
#>   label                                 test.details     p.value.adjustment
#>   <chr>                                 <chr>            <chr>
#> 1 list(~italic(p)[ adjusted ]== 1.000 ) Student's t-test Bonferroni
#> 2 list(~italic(p)[ adjusted ]== 1.000 ) Student's t-test Bonferroni
#> 3 list(~italic(p)[ adjusted ]== 1.000 ) Student's t-test Bonferroni
#> 4 list(~italic(p)[ adjusted ]== 1.000 ) Student's t-test Bonferroni
#> 5 list(~italic(p)[ adjusted ]== 0.979 ) Student's t-test Bonferroni
#> 6 list(~italic(p)[ adjusted ]== 1.000 ) Student's t-test Bonferroni

# if `var.equal = FALSE`, then Games-Howell test will be run
pairwise_comparisons(
  data = ggplot2::msleep,
  x = vore,
  y = brainwt,
  type = "parametric",
  var.equal = FALSE,
  paired = FALSE,
  p.adjust.method = "bonferroni"
)
#> # A tibble: 6 x 11
#>   group1 group2  mean.difference    se t.value    df p.value significance
#>   <chr>  <chr>             <dbl> <dbl>   <dbl> <dbl>   <dbl> <chr>
#> 1 carni  insecti          -0.058 0.027   1.53   10.7       1 ns
#> 2 herbi  carni            -0.542 0.25    1.54   19.4       1 ns
#> 3 herbi  insecti          -0.6   0.249   1.70   19.1       1 ns
#> 4 omni   carni            -0.066 0.061   0.774  21.1       1 ns
#> 5 omni   herbi             0.476 0.255   1.32   20.9       1 ns
#> 6 omni   insecti          -0.124 0.057   1.55   17.2       1 ns
#>   label                                 test.details      p.value.adjustment
#>   <chr>                                 <chr>             <chr>
#> 1 list(~italic(p)[ adjusted ]== 1.000 ) Games-Howell test Bonferroni
#> 2 list(~italic(p)[ adjusted ]== 1.000 ) Games-Howell test Bonferroni
#> 3 list(~italic(p)[ adjusted ]== 1.000 ) Games-Howell test Bonferroni
#> 4 list(~italic(p)[ adjusted ]== 1.000 ) Games-Howell test Bonferroni
#> 5 list(~italic(p)[ adjusted ]== 1.000 ) Games-Howell test Bonferroni
#> 6 list(~italic(p)[ adjusted ]== 1.000 ) Games-Howell test Bonferroni

# non-parametric
pairwise_comparisons(
  data = ggplot2::msleep,
  x = vore,
  y = brainwt,
  type = "nonparametric",
  paired = FALSE,
  p.adjust.method = "none"
)
#> # A tibble: 6 x 8
#>   group1  group2  z.value p.value significance
#>   <chr>   <chr>     <dbl>   <dbl> <chr>
#> 1 carni   herbi     0.582  0.561  ns
#> 2 carni   insecti   1.88   0.0595 ns
#> 3 carni   omni      1.14   0.254  ns
#> 4 herbi   insecti   1.63   0.102  ns
#> 5 herbi   omni      0.717  0.474  ns
#> 6 insecti omni      1.14   0.254  ns
#>   label                                   test.details p.value.adjustment
#>   <chr>                                   <chr>        <chr>
#> 1 list(~italic(p)[ unadjusted ]== 0.561 ) Dunn test    None
#> 2 list(~italic(p)[ unadjusted ]== 0.060 ) Dunn test    None
#> 3 list(~italic(p)[ unadjusted ]== 0.254 ) Dunn test    None
#> 4 list(~italic(p)[ unadjusted ]== 0.102 ) Dunn test    None
#> 5 list(~italic(p)[ unadjusted ]== 0.474 ) Dunn test    None
#> 6 list(~italic(p)[ unadjusted ]== 0.254 ) Dunn test    None

# robust
pairwise_comparisons(
  data = ggplot2::msleep,
  x = vore,
  y = brainwt,
  type = "robust",
  paired = FALSE,
  p.adjust.method = "fdr"
)
#> # A tibble: 6 x 10
#>   group1  group2    psihat conf.low conf.high p.value significance
#>   <chr>   <chr>      <dbl>    <dbl>     <dbl>   <dbl> <chr>
#> 1 carni   herbi   -0.0530   -0.274     0.168    0.969 ns
#> 2 carni   insecti  0.0577   -0.0609    0.176    0.969 ns
#> 3 carni   omni     0.00210  -0.151     0.155    0.969 ns
#> 4 herbi   insecti  0.111    -0.0983    0.320    0.969 ns
#> 5 herbi   omni     0.0551   -0.173     0.283    0.969 ns
#> 6 insecti omni    -0.0556   -0.184     0.0728   0.969 ns
#>   label                                 test.details
#>   <chr>                                 <chr>
#> 1 list(~italic(p)[ adjusted ]== 0.969 ) Yuen's trimmed means test
#> 2 list(~italic(p)[ adjusted ]== 0.969 ) Yuen's trimmed means test
#> 3 list(~italic(p)[ adjusted ]== 0.969 ) Yuen's trimmed means test
#> 4 list(~italic(p)[ adjusted ]== 0.969 ) Yuen's trimmed means test
#> 5 list(~italic(p)[ adjusted ]== 0.969 ) Yuen's trimmed means test
#> 6 list(~italic(p)[ adjusted ]== 0.969 ) Yuen's trimmed means test
#>   p.value.adjustment
#>   <chr>
#> 1 Benjamini & Hochberg
#> 2 Benjamini & Hochberg
#> 3 Benjamini & Hochberg
#> 4 Benjamini & Hochberg
#> 5 Benjamini & Hochberg
#> 6 Benjamini & Hochberg

# Bayes Factor
pairwise_comparisons(
  data = ggplot2::msleep,
  x = vore,
  y = brainwt,
  type = "bayes",
  paired = FALSE
)
#> # A tibble: 6 x 11
#>   group1 group2   bf10  bf01 log_e_bf10 log_e_bf01 log_10_bf10 log_10_bf01
#>   <chr>  <chr>   <dbl> <dbl>      <dbl>      <dbl>       <dbl>       <dbl>
#> 1 omni   herbi   0.571  1.75     -0.560      0.560      -0.243       0.243
#> 2 omni   carni   0.427  2.34     -0.851      0.851      -0.369       0.369
#> 3 omni   insecti 0.545  1.83     -0.606      0.606      -0.263       0.263
#> 4 herbi  carni   0.540  1.85     -0.617      0.617      -0.268       0.268
#> 5 herbi  insecti 0.540  1.85     -0.616      0.616      -0.267       0.267
#> 6 carni  insecti 0.718  1.39     -0.332      0.332      -0.144       0.144
#>   bf.prior label                        test.details
#>      <dbl> <chr>                        <chr>
#> 1    0.707 list(~log[e](BF[10])==-0.56) Student's t-test
#> 2    0.707 list(~log[e](BF[10])==-0.85) Student's t-test
#> 3    0.707 list(~log[e](BF[10])==-0.61) Student's t-test
#> 4    0.707 list(~log[e](BF[10])==-0.62) Student's t-test
#> 5    0.707 list(~log[e](BF[10])==-0.62) Student's t-test
#> 6 0.707 list(~log[e](BF[10])==-0.33) Student's t-test# for reproducibility
set.seed(123)
# parametric
pairwise_comparisons(
data = bugs_long,
x = condition,
y = desire,
type = "parametric",
paired = TRUE,
p.adjust.method = "BH"
)
#> # A tibble: 6 x 8
#> group1 group2 mean.difference p.value significance
#> <chr> <chr> <dbl> <dbl> <chr>
#> 1 HDHF HDLF -1.15 1.06e- 3 **
#> 2 HDHF LDHF -0.472 7.02e- 2 ns
#> 3 HDHF LDLF -2.16 3.95e-12 ***
#> 4 HDLF LDHF 0.676 6.74e- 2 ns
#> 5 HDLF LDLF -1.02 1.99e- 3 **
#> 6 LDHF LDLF -1.69 6.66e- 9 ***
#> label test.details p.value.adjustment
#> <chr> <chr> <chr>
#> 1 list(~italic(p)[ adjusted ]== 0.001 ) Student's t-test Benjamini & Hochberg
#> 2 list(~italic(p)[ adjusted ]== 0.070 ) Student's t-test Benjamini & Hochberg
#> 3 list(~italic(p)[ adjusted ]<= 0.001 ) Student's t-test Benjamini & Hochberg
#> 4 list(~italic(p)[ adjusted ]== 0.067 ) Student's t-test Benjamini & Hochberg
#> 5 list(~italic(p)[ adjusted ]== 0.002 ) Student's t-test Benjamini & Hochberg
#> 6 list(~italic(p)[ adjusted ]<= 0.001 ) Student's t-test Benjamini & Hochberg
# non-parametric
pairwise_comparisons(
data = bugs_long,
x = condition,
y = desire,
type = "nonparametric",
paired = TRUE,
p.adjust.method = "BY"
)
#> # A tibble: 6 x 8
#> group1 group2 W p.value significance
#> <chr> <chr> <dbl> <dbl> <chr>
#> 1 HDHF HDLF 4.78 1.44e- 5 ***
#> 2 HDHF LDHF 2.44 4.47e- 2 *
#> 3 HDHF LDLF 8.01 5.45e-13 ***
#> 4 HDLF LDHF 2.34 4.96e- 2 *
#> 5 HDLF LDLF 3.23 5.05e- 3 **
#> 6 LDHF LDLF 5.57 4.64e- 7 ***
#> label test.details
#> <chr> <chr>
#> 1 list(~italic(p)[ adjusted ]<= 0.001 ) Durbin-Conover test
#> 2 list(~italic(p)[ adjusted ]== 0.045 ) Durbin-Conover test
#> 3 list(~italic(p)[ adjusted ]<= 0.001 ) Durbin-Conover test
#> 4 list(~italic(p)[ adjusted ]== 0.050 ) Durbin-Conover test
#> 5 list(~italic(p)[ adjusted ]== 0.005 ) Durbin-Conover test
#> 6 list(~italic(p)[ adjusted ]<= 0.001 ) Durbin-Conover test
#> p.value.adjustment
#> <chr>
#> 1 Benjamini & Yekutieli
#> 2 Benjamini & Yekutieli
#> 3 Benjamini & Yekutieli
#> 4 Benjamini & Yekutieli
#> 5 Benjamini & Yekutieli
#> 6 Benjamini & Yekutieli
# robust
pairwise_comparisons(
data = bugs_long,
x = condition,
y = desire,
type = "robust",
paired = TRUE,
p.adjust.method = "hommel"
)
#> # A tibble: 6 x 10
#> group1 group2 psihat conf.low conf.high p.value significance
#> <chr> <chr> <dbl> <dbl> <dbl> <dbl> <chr>
#> 1 HDLF HDHF -1.16 -2.00 -0.318 1.49e- 3 **
#> 2 LDHF HDHF -0.5 -1.19 0.188 6.20e- 2 ns
#> 3 LDHF HDLF 0.701 -0.303 1.71 6.20e- 2 ns
#> 4 LDLF HDHF -2.10 -2.82 -1.37 1.79e-10 ***
#> 5 LDLF HDLF -0.938 -1.81 -0.0694 1.36e- 2 *
#> 6 LDLF LDHF -1.54 -2.27 -0.810 1.16e- 6 ***
#> label test.details
#> <chr> <chr>
#> 1 list(~italic(p)[ adjusted ]== 0.001 ) Yuen's trimmed means test
#> 2 list(~italic(p)[ adjusted ]== 0.062 ) Yuen's trimmed means test
#> 3 list(~italic(p)[ adjusted ]== 0.062 ) Yuen's trimmed means test
#> 4 list(~italic(p)[ adjusted ]<= 0.001 ) Yuen's trimmed means test
#> 5 list(~italic(p)[ adjusted ]== 0.014 ) Yuen's trimmed means test
#> 6 list(~italic(p)[ adjusted ]<= 0.001 ) Yuen's trimmed means test
#> p.value.adjustment
#> <chr>
#> 1 Hommel
#> 2 Hommel
#> 3 Hommel
#> 4 Hommel
#> 5 Hommel
#> 6 Hommel
# Bayes Factor
pairwise_comparisons(
data = WRS2::WineTasting,
x = Wine,
y = Taste,
type = "bayes",
paired = TRUE,
bf.prior = 0.77
)
#> # A tibble: 3 x 11
#> group1 group2 bf10 bf01 log_e_bf10 log_e_bf01 log_10_bf10 log_10_bf01
#> <chr> <chr> <dbl> <dbl> <dbl> <dbl> <dbl> <dbl>
#> 1 Wine A Wine B 0.219 4.57 -1.52 1.52 -0.660 0.660
#> 2 Wine A Wine C 3.60 0.277 1.28 -1.28 0.557 -0.557
#> 3 Wine B Wine C 50.5 0.0198 3.92 -3.92 1.70 -1.70
#> bf.prior label test.details
#> <dbl> <chr> <chr>
#> 1 0.77 list(~log[e](BF[10])==-1.52) Student's t-test
#> 2 0.77 list(~log[e](BF[10])==1.28) Student's t-test
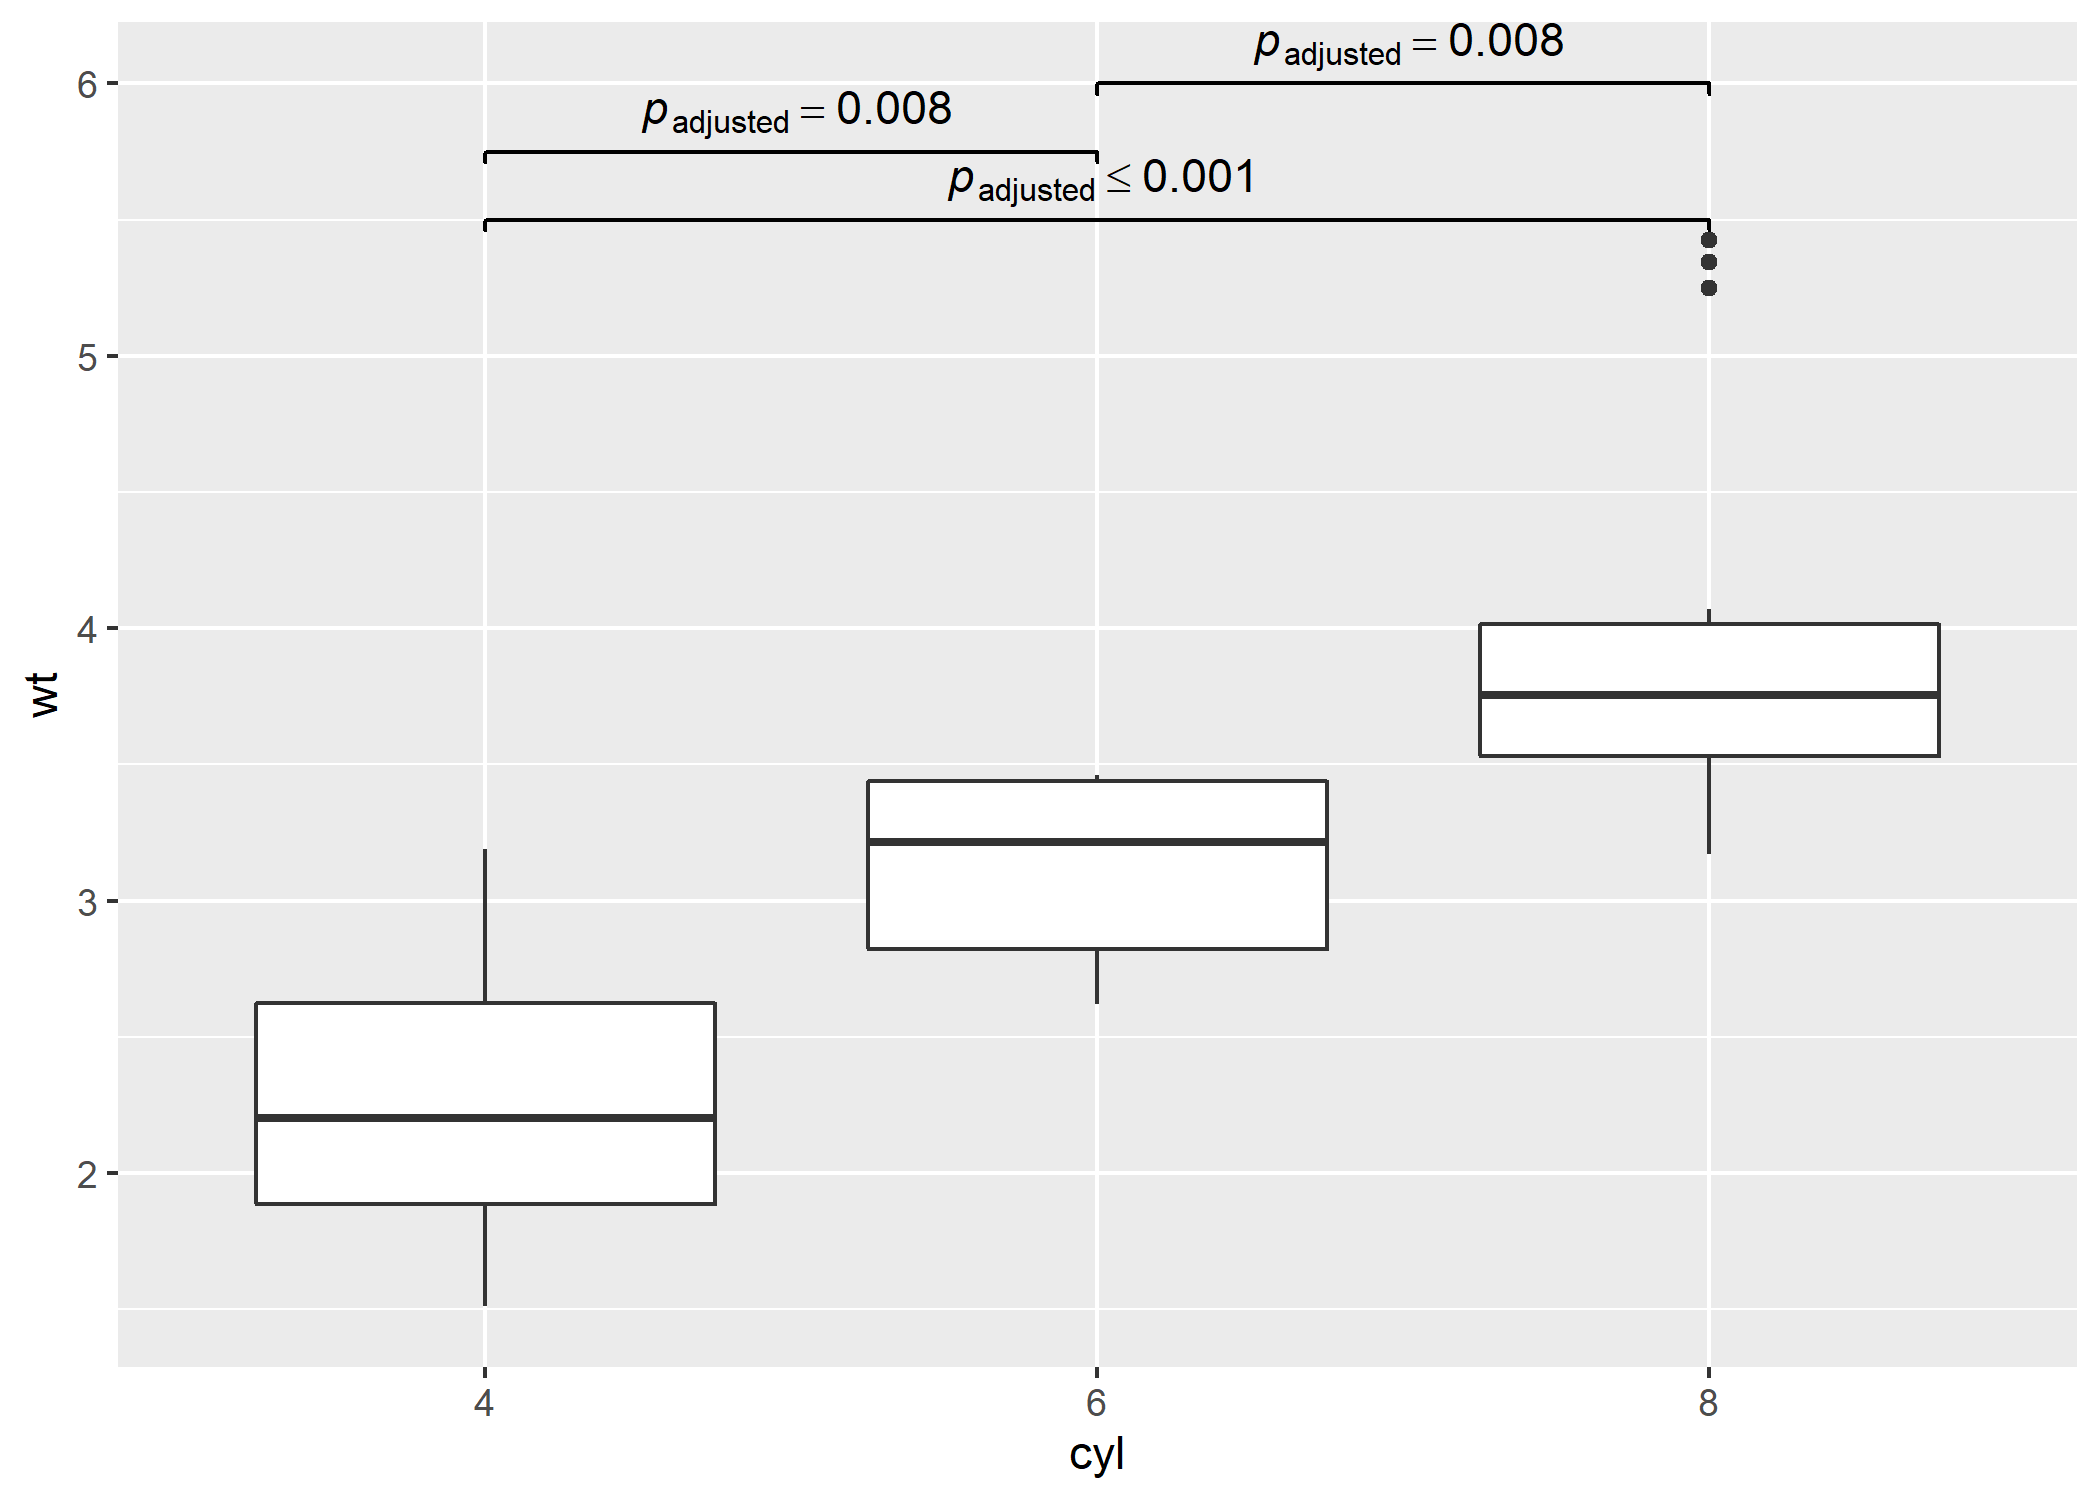
#> 3 0.77 list(~log[e](BF[10])==3.92) Student's t-testpairwiseComparisons with ggsignif to display results# needed libraries
library(ggplot2)
library(pairwiseComparisons)
library(ggsignif)
# converting to factor
mtcars$cyl <- as.factor(mtcars$cyl)
# creating a basic plot
p <- ggplot(mtcars, aes(cyl, wt)) + geom_boxplot()
# using `pairwiseComparisons` package to create a dataframe with results
(df <-
pairwise_comparisons(mtcars, cyl, wt, messages = FALSE) %>%
dplyr::mutate(.data = ., groups = purrr::pmap(.l = list(group1, group2), .f = c)) %>%
dplyr::arrange(.data = ., group1))
#> # A tibble: 3 x 12
#> group1 group2 mean.difference se t.value df p.value significance
#> <chr> <chr> <dbl> <dbl> <dbl> <dbl> <dbl> <chr>
#> 1 4 8 1.71 0.188 6.44 23.0 0 ***
#> 2 6 4 -0.831 0.154 3.81 16.0 0.008 **
#> 3 6 8 0.882 0.172 3.62 19.0 0.008 **
#> label test.details p.value.adjustment
#> <chr> <chr> <chr>
#> 1 list(~italic(p)[ adjusted ]<= 0.001 ) Games-Howell test Holm
#> 2 list(~italic(p)[ adjusted ]== 0.008 ) Games-Howell test Holm
#> 3 list(~italic(p)[ adjusted ]== 0.008 ) Games-Howell test Holm
#> groups
#> <list>
#> 1 <chr [2]>
#> 2 <chr [2]>
#> 3 <chr [2]>
# using `geom_signif` to display results
p +
ggsignif::geom_signif(
comparisons = df$groups,
map_signif_level = TRUE,
tip_length = 0.01,
y_position = c(5.5, 5.75, 6),
annotations = df$label,
test = NULL,
na.rm = TRUE,
parse = TRUE
)
# needed libraries
library(ggplot2)
library(pairwiseComparisons)
library(ggsignif)

# creating a basic plot
p <- ggplot(WRS2::WineTasting, aes(Wine, Taste)) + geom_boxplot()

# using `pairwiseComparisons` package to create a dataframe with results
(df <-
  pairwise_comparisons(WRS2::WineTasting, Wine, Taste, type = "bayes", paired = TRUE) %>%
  dplyr::mutate(.data = ., groups = purrr::pmap(.l = list(group1, group2), .f = c)) %>%
  dplyr::arrange(.data = ., group1))
#> # A tibble: 3 x 12
#>   group1 group2   bf10   bf01 log_e_bf10 log_e_bf01 log_10_bf10 log_10_bf01
#>   <chr>  <chr>   <dbl>  <dbl>      <dbl>      <dbl>       <dbl>       <dbl>
#> 1 Wine A Wine B  0.235 4.25        -1.45       1.45      -0.628       0.628
#> 2 Wine A Wine C  3.71  0.269        1.31      -1.31       0.570      -0.570
#> 3 Wine B Wine C 50.5   0.0198       3.92      -3.92       1.70       -1.70
#>   bf.prior label                        test.details     groups
#>      <dbl> <chr>                        <chr>            <list>
#> 1    0.707 list(~log[e](BF[10])==-1.45) Student's t-test <chr [2]>
#> 2    0.707 list(~log[e](BF[10])==1.31)  Student's t-test <chr [2]>
#> 3    0.707 list(~log[e](BF[10])==3.92)  Student's t-test <chr [2]>

# using `geom_signif` to display results
p +
  ggsignif::geom_signif(
    comparisons = df$groups,
    map_signif_level = TRUE,
    tip_length = 0.01,
    y_position = c(6.5, 6.65, 6.8),
    annotations = df$label,
    test = NULL,
    na.rm = TRUE,
    parse = TRUE
  )
The hexsticker was generously designed by Sarah Otterstetter (Max Planck Institute for Human Development, Berlin).
I’m happy to receive bug reports, suggestions, questions, and (most of all) contributions to fix problems and add features. I personally prefer using the GitHub issues system over trying to reach out to me in other ways (personal e-mail, Twitter, etc.). Pull Requests for contributions are encouraged.
Here are some simple ways in which you can contribute (in the increasing order of commitment):
Read and correct any inconsistencies in the documentation
Raise issues about bugs or wanted features
Review code
Add new functionality (in the form of new plotting functions or helpers for preparing subtitles)
Please note that this project is released with a Contributor Code of Conduct. By participating in this project you agree to abide by its terms.