
![]()

The goal of overviewR is to make it easy to get an overview of a data set by displaying relevant sample information. At the moment, there are two functions (overview_tab and overview_crosstab) that generate a tabular overview of the general sample as well as a conditional sample. The general sample plots a two-column table that provides information on an id in the left column and a the time frame on the right column. The conditional column allows to disaggregate the overview table by specifying two conditions, hence resulting a 2x2 table. This way, it is easy to visualize the time and scope conditions as well as theoretical assumptions with examples from the data set. The function overview_print converts this output of both overview_tab and overview_crosstab into LaTeX code and/or directly into a .tex file.
The output of overview_tab and overview_crosstab are also compatible with other packages such as xtable, flextable, or knitr.
The latest version of overviewR can be installed directly from GitHub using:
First, load the package.
The following examples use a toy data set (toydata) that comes with the package. This data contains artificially generated information in a cross-sectional format on 5 countries, covering the period 1990-1999.
data(toydata)
head(toydata)
#>   ccode year month      gdp population
#> 1   RWA 1990   Jan 24180.77  14969.988
#> 2   RWA 1990   Feb 23650.53  11791.464
#> 3   RWA 1990   Mar 21860.14  30047.979
#> 4   RWA 1990   Apr 20801.06  19853.556
#> 5   RWA 1990   May 18702.84   5148.118
#> 6   RWA 1990   Jun 30272.37  48625.140
There are 264 observations for 5 countries (Angola, Benin, France, Rwanda, and UK) stored in the ccode variable, over a time period between 1990 to 1999 (year) with additional information for the month (month). Additionally, two artificially generated fake variables for GDP (gdp) and population size (population) are included to illustrate of conditions.
The following functions work best on data sets that have an id-time-structure, in the case of toydata this corresponds to country-year with ccode and year. If the data set does not have this format yet, consider using pivot_wider() or pivot_longer() to get to the format.
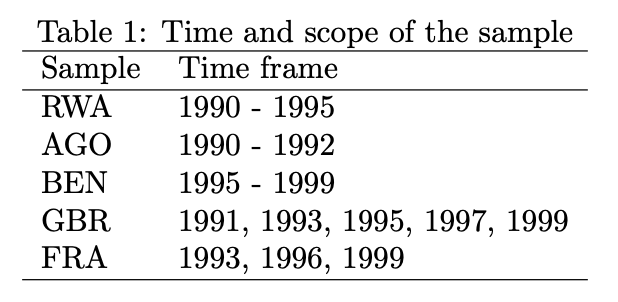
overview_tabGenerate some general overview of the data set using the time and scope conditions with overview_tab.
The resulting data frame collapses the time condition for each id by taking into account potential gaps in the time frame. Note that the column name for the time frame is set by default to time_frame and internally generated when using overview_tab.
# ccode   time_frame
# RWA       1990 - 1995
# AGO       1990 - 1992
# BEN       1995 - 1999
# GBR       1991, 1993, 1995, 1997, 1999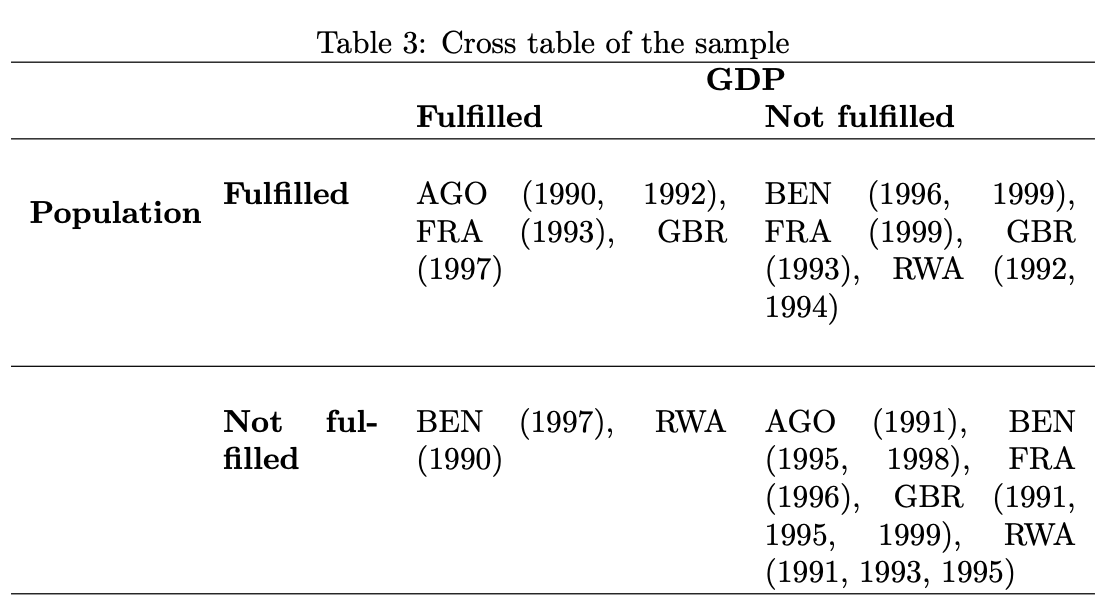
# FRA 1993, 1996, 1999overview_crosstabTo generate a cross table that divides the data based on two conditions, for instance GDP and population size, overview_crosstab can be used. threshold1 and threshold2 thereby indicate the cut point for the two conditions (cond1 and cond2), respectively.
output_crosstab <- overview_crosstab(
    dat = toydata,
    cond1 = gdp,
    cond2 = population,
    threshold1 = 25000,
    threshold2 = 27000,
    id = ccode,
    time = year
  )
The data frame output looks as follows:
#   part1                                      part2
# 1 AGO (1990, 1992), FRA (1993), GBR (1997)   BEN (1996, 1999), FRA (1999), GBR (1993), RWA (1992, 1994)
# 2 BEN (1997), RWA (1990)                     AGO (1991), BEN (1995, 1998), FRA (1996), GBR (1991, 1995, 1999), RWA (1991, 1993, 1995)
Note, if a data set is used that has multiple observations on the id-time unit, the function automatically aggregates the data set using the mean of condition 1 (cond1) and condition 2 (cond2).
overview_printTo generate an easily usable LaTeX output for the generated overview_tab and overview_crosstab objects, overviewR offers the function overview_print. The following illustrate this using the output_table object from overview_tab.
LaTeX output
% Overview table generated in R version 4.0.0 (2020-04-24) using overviewR
% Table created on 2020-06-21
\begin{table}[ht]
 \centering
 \caption{Time and scope of the sample}
 \begin{tabular}{ll}
 \hline
Sample & Time frame \\
\hline
 RWA & 1990 - 1995 \\
 AGO & 1990 - 1992 \\
 BEN & 1995 - 1999 \\
 GBR & 1991, 1993, 1995, 1997, 1999 \\
 FRA & 1993, 1996, 1999 \\
 \hline
 \end{tabular}
 \end{table}
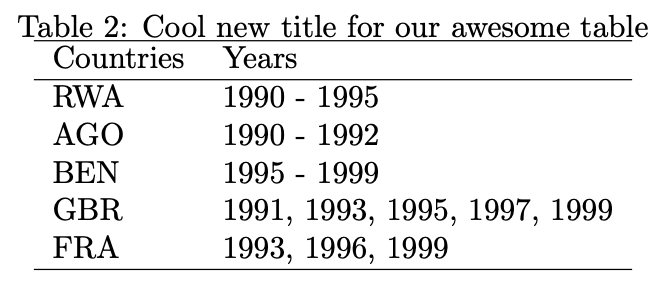
The default already provides a title (“Time and scope of the sample”) that can be modified in the argument title. The same holds for the column names (“Sample” and “Time frame” are set by default but can be modified as shown below).
overview_print(obj = output_table, id = "Countries", time = "Years",
               title = "Cool new title for our awesome table")
LaTeX output
% Overview table generated in R version 4.0.0 (2020-04-24) using overviewR
% Table created on 2020-06-21
\begin{table}[ht]
 \centering
 \caption{Cool new title for our awesome table}
 \begin{tabular}{ll}
 \hline
Countries & Years \\
\hline
 RWA & 1990 - 1995 \\
 AGO & 1990 - 1992 \\
 BEN & 1995 - 1999 \\
 GBR & 1991, 1993, 1995, 1997, 1999 \\
 FRA & 1993, 1996, 1999 \\
 \hline
 \end{tabular}
 \end{table}
The same function can also be used for outputs from the overview_crosstab function by using the argument crosstab = TRUE. There are also options to label the respective conditions (cond1 and cond2). Note that this should correspond to the conditions (cond1 and cond2) specified in the overview_crosstab function.
overview_print(
  obj = output_crosstab,
  title = "Cross table of the sample",
  crosstab = TRUE,
  cond1 = "GDP",
  cond2 = "Population"
)
LaTeX output
% Overview table generated in R version 4.0.0 (2020-04-24) using overviewR
% Table created on 2020-06-21
% Please add the following packages to your document preamble:
% \usepackage{multirow}
% \usepackage{tabularx}
% \newcolumntype{b}{X}
% \newcolumntype{s}{>{\hsize=.5\hsize}X}
\begin{table}[ht]
\caption{Cross table of the sample}
 \begin{tabularx}{\textwidth}{ssbb}
\hline & & \multicolumn{2}{c}{\textbf{GDP}} \\
 & & \textbf{Fulfilled} & \textbf{Not fulfilled} \\
 \hline \\
 \multirow{2}{*}{\textbf{Population}} & \textbf{Fulfilled} &
 AGO (1990, 1992), FRA (1993), GBR (1997) & BEN (1996, 1999), FRA (1999), GBR (1993), RWA (1992, 1994)\\
 \\ \hline \\
 & \textbf{Not fulfilled} &  BEN (1997), RWA (1990) & AGO (1991), BEN (1995, 1998), FRA (1996), GBR (1991, 1995, 1999), RWA (1991, 1993, 1995)\\  \hline \\
 \end{tabularx}
 \end{table}
With save_out = TRUE the function exports the output as a .tex file and stores it on the device.
The outputs of overview_tab and overview_crosstab are also compatible with other functions such as xtable, flextable, or kable from knitr.
Two examples are shown below:
library(flextable)
table_output <- qflextable(output_table)
table_output <-
  set_header_labels(table_output,
                    ccode = "Countries",
                    time_frame = "Time frame")
set_table_properties(
  table_output,
  width = .4,
  layout = "autofit"
)| ccode | time_frame |
|---|---|
| RWA | 1990-1995 |
| AGO | 1990-1992 |
| BEN | 1995-1999 |
| GBR | 1991, 1993, 1995, 1997, 1999 |
| FRA | 1993, 1996, 1999 |
The hex sticker is generated by ourselves using the hexSticker package.