Package website: release | dev
![]()
![]()
This R package provides visualizations for mlr3 objects such as tasks, predictions, resample results or benchmark results via the autoplot() generic of ggplot2.
Install the last release from CRAN:
Install the development version from GitHub:
library(mlr3)
library(mlr3viz)
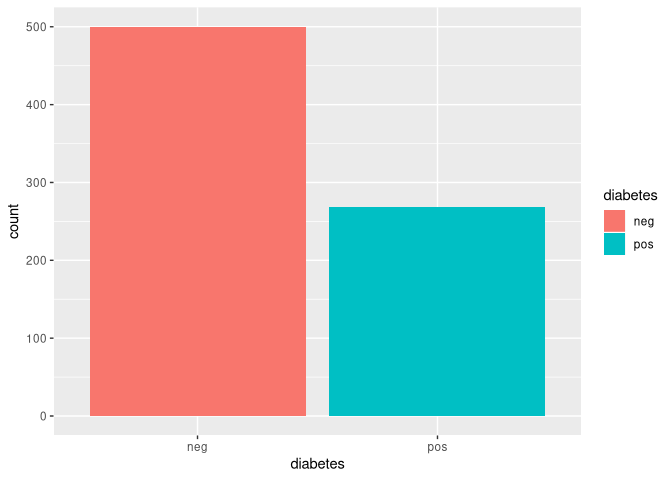
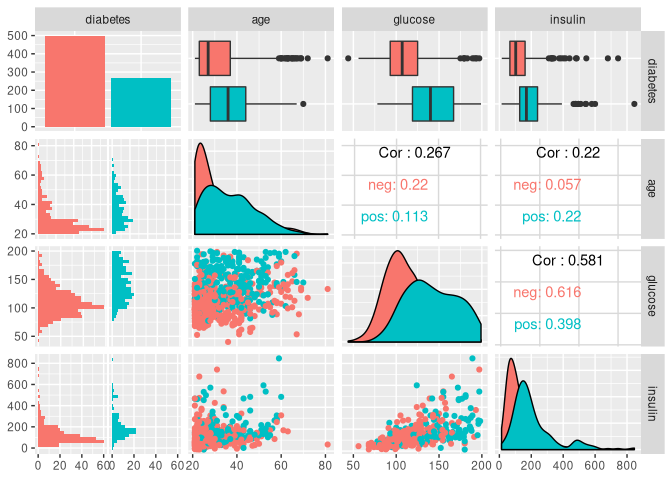
task = tsk("pima")$select(c("age", "glucose", "insulin"))
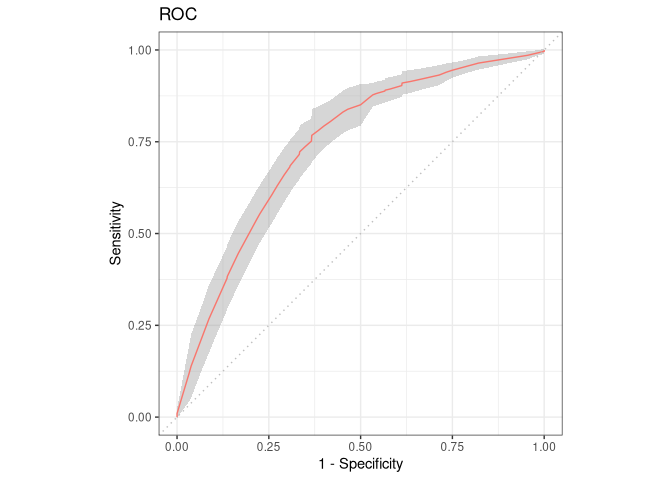
learner = lrn("classif.rpart", predict_type = "prob")
rr = resample(task, learner, rsmp("cv", folds = 10))
# Default plot for task
autoplot(task)