
![]()

![]()
![]()
Color blindness affects a large number of individuals. When communicating scientific results colour palettes must therefore be carefully chosen to be accessible to all readers.
This R package provides an implementation of Paul Tol’s colour schemes[1]. These schemes are ready for each type of data (qualitative, diverging or sequential), with colours that are distinct for all people, including colour-blind readers. This package also provides tools to simulate colour-blindness and to test how well the colours of any palette are identifiable. To simulate colour-blindness in production-ready R figures you may also be interested in the colorblindr package.
For specific uses, several scientific thematic schemes (geologic timescale, land cover, FAO soils, etc.) are implemented, but these colour schemes may not be colour-blind safe.
All these colour schemes are implemented for use with R graphics or ggplot2.
You can install the released version of khroma from CRAN:
Or install the development version from GitHub with:
colour() returns a palette function that when called with a single integer argument returns a vector of colours.
If crayon is installed, colours will be nicely printed in the console.
#> #4477AA #EE6677 #228833 #CCBB44 #66CCEE #AA3377 #BBBBBB
You can disable this feature by setting the crayon.enabled option to FALSE.
options(crayon.enabled = FALSE)
bright(7)
#>      blue       red     green    yellow      cyan    purple      grey
#> "#4477AA" "#EE6677" "#228833" "#CCBB44" "#66CCEE" "#AA3377" "#BBBBBB"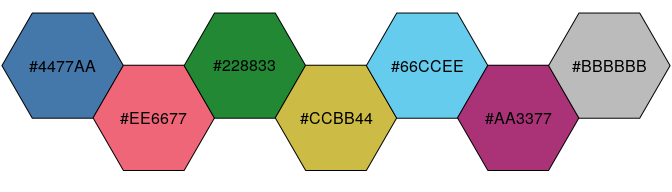
# Use with ggplot2
ggplot(data = mpg, mapping = aes(x = displ, y = hwy, colour = class)) +
  geom_point() +
  scale_colour_bright()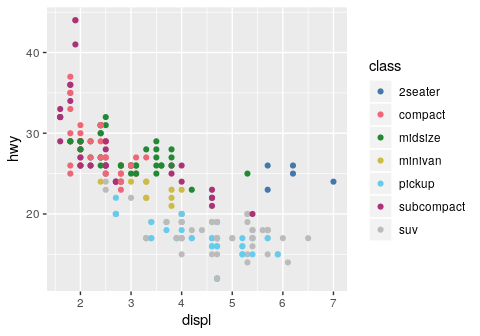
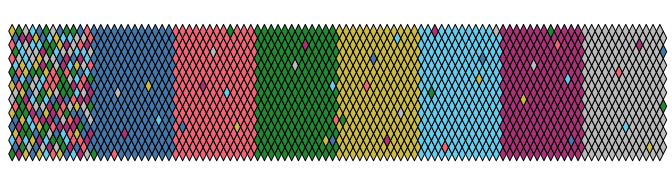
# Simulate colour-blindness
# convert() returns a modified palette function
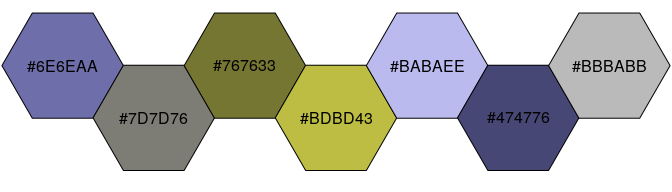
deuteranopia <- convert(bright, mode = "deuteranopia")
plot_scheme(deuteranopia(7), colours = TRUE)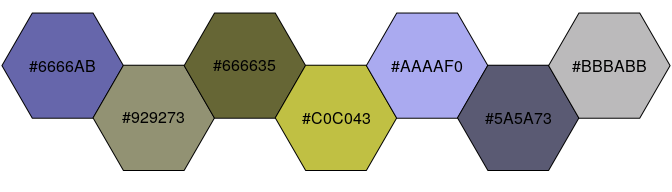
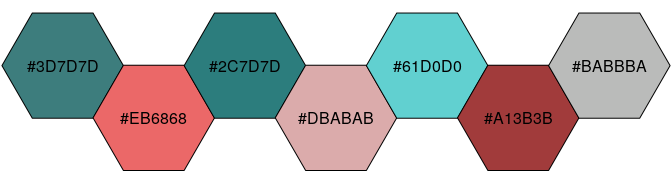
achromatopsia <- convert(bright, mode = "achromatopsia")
plot_scheme(achromatopsia(7), colours = TRUE)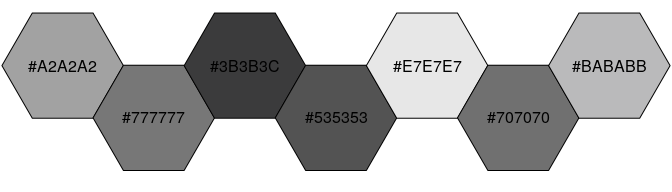
Paul Tol offers carefully chosen schemes, ready for each type of data, with colours that are:
All the scales presented in Paul Tol’s technical note are implemented here, for use with graphics or ggplot2. Refer to the original document for details about the recommended uses.
See the vignette for a more complete overview:
The following scientific colour schemes are available:
More will be added in future releases (suggestions are welcome).
Please note that the khroma project is released with a Contributor Code of Conduct. By contributing to this project, you agree to abide by its terms.