The purpose of ibdsim2 is to simulate and analyse the gene flow in pedigrees. In particular, such simulations can be used to study distributions of chromosomal segments shared identical-by-descent (IBD) by pedigree members. In each meiosis, the recombination process is simulated using sex specific recombination rates in the human genome (Halldorsson et al., 2019), or with recombination maps provided by the user. Additional features include calculation of realised relatedness coefficients, distribution plots of IBD segments, and estimation of two-locus relatedness coefficients.
ibdsim2 is an updated and improved version of IBDsim. In particular, the underlying pedigree structure is now imported from the pedtools package instead of its predecessor paramlink, which is no longer actively developed. In addition to the transition to pedtools, several new features are added in ibdsim2, including karyogram plots and analysis of IBD absence between (genealogically) related individuals.
ibdsim2 is under development and can be installed from GitHub as follows:
 # First install devtools if needed
if(!require(devtools)) install.packages("devtools")

# Install pedtools from github
devtools::install_github("magnusdv/ibdsim2")In this example we will compare the distributions of counts/lengths of IBD segments between the following pairwise relationships:
Note that GR and HS have the same relatedness coefficients (= (12, 12, 0)), meaning that they are genetically indistinguishable in the context of unlinked loci. In contrast, HU has (= (34, 14, 0)).
We start by loading ibdsim2.
For simplicity we create a pedigree containing all the three relationships we are interested in.
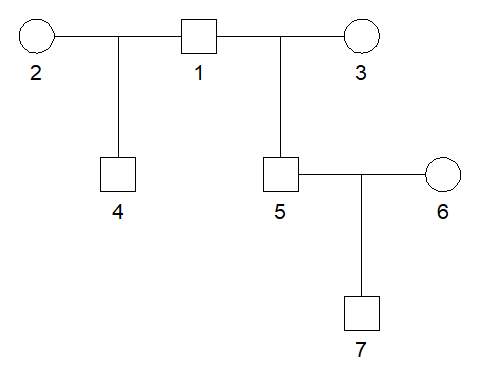
We store the ID labels of the three relationships in a list.
Next, we use ibdsim() to produce 1000 simulations of the underlying IBD pattern in the entire pedigree.
s = ibdsim(x, N = 1000, map = loadMap("decode19"))
#> Simulation parameters:
#> # simulations: 1000
#> Chromosomes  : 1-22
#> Genome length: 2753.931711 Mb
#> Recomb model : chi
#> Target indivs: 1-7
#> Skip recomb  : -
#> Total time used: 43.6 secs
The plotSegmentDistribution() function, with the option type = "ibd1" analyses the IBD segments in each simulation, and makes a nice plot. Note that the names of the ids list are used in the legend.
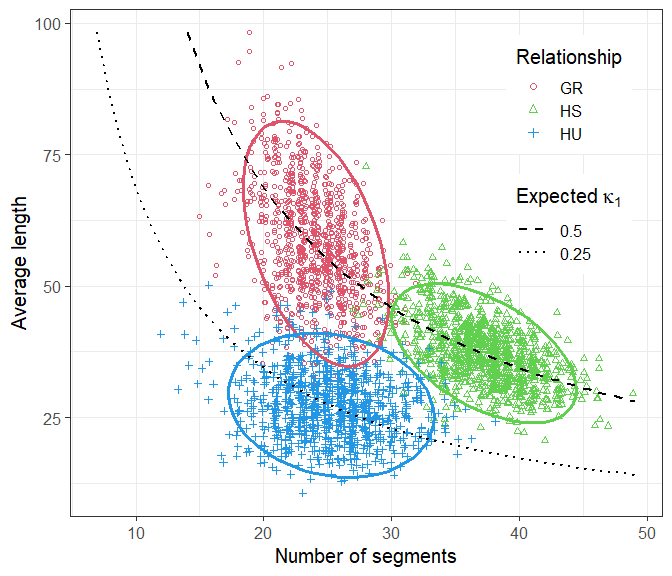
We conclude that the three distributions are almost completely disjoint. In particular, this suggests that GR and HS relationships are separable on the basis of their IBD segments, if these can be determined accurately enough.