
![]()
ggnewscale tries to make it painless to use multiple scales in ggplot2. Although originally intended to use with colour and fill, it should work with any aes, such as shape, linetype and the rest. It’s very experimental, so use at your own risk!
For another way of defining multiple scales, you can also try relayer.
You can install ggnewscale from CRAN with:
Or the development version with:
You can test the package in this RStudio Cloud instance without installing anything on your computer.
The main function is new_scale() and its aliases new_scale_color() and new_scale_fill(). When added to a plot, every geom added after them will use a different scale.
As an example, let’s overlay some measurements over a contour map of topography using the beloved volcano.
library(ggplot2)
library(ggnewscale)
# Equivalent to melt(volcano)
topography <- expand.grid(x = 1:nrow(volcano),
                          y = 1:ncol(volcano))
topography$z <- c(volcano)

# point measurements of something at a few locations
set.seed(42)
measurements <- data.frame(x = runif(30, 1, 80),
                           y = runif(30, 1, 60),
                           thing = rnorm(30))

ggplot(mapping = aes(x, y)) +
  geom_contour(data = topography, aes(z = z, color = stat(level))) +
  # Color scale for topography
  scale_color_viridis_c(option = "D") +
  # geoms below will use another color scale
  new_scale_color() +
  geom_point(data = measurements, size = 3, aes(color = thing)) +
  # Color scale applied to geoms added after new_scale_color()
  scale_color_viridis_c(option = "A")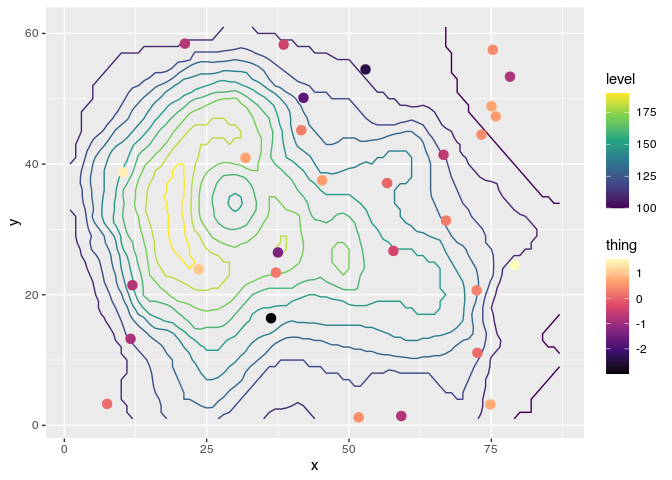
If you want to create new scales for other aes, you can call new_scale with the name of the aes. For example, use
to add multiple linetype scales.