
ggmosaic was designed to create visualizations of categorical data and is capable of producing bar charts, stacked bar charts, mosaic plots, and double decker plots.
You can install ggmosaic from github with:
library(ggmosaic)
#> Loading required package: ggplot2
ggplot(data = fly) +
  geom_mosaic(aes(x = product(RudeToRecline), fill=DoYouRecline))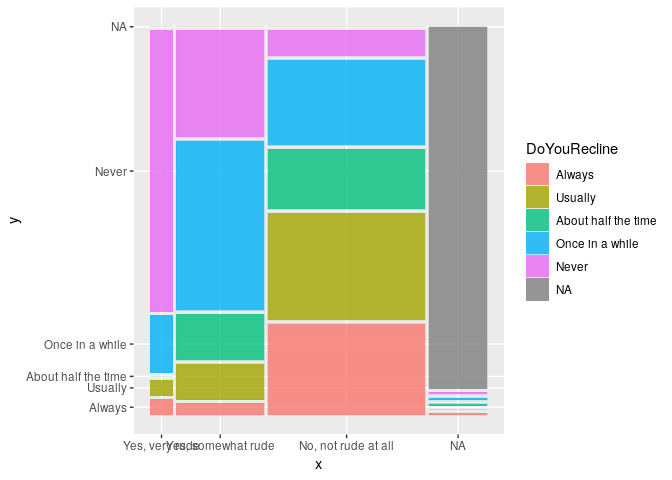
Aesthetics that can be set:
These values are then sent through productplots functions to create the formula for the desired distribution
Formula: weight ~ fill + x | conds
Example of how the formula is built
These aesthetics set up the formula for the distribution: 1 ~ W + X + Y | Z
Because a mosaic plot is constructed hierarchically through alternating spines, the ordering of the variables is very important.