‘ggVennDiagram’ enables fancy venn plot with 2-4 sets and generates publication quality figure. It is the first software that can automatically fill different colors to each part of a venn diagram.
You can install the released version of ggVennDiagram from CRAN with (under evaluation in CRAN):
And the development version from GitHub with:
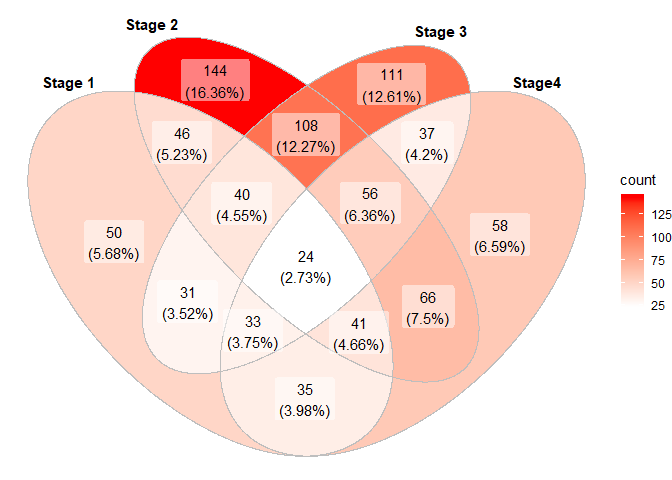
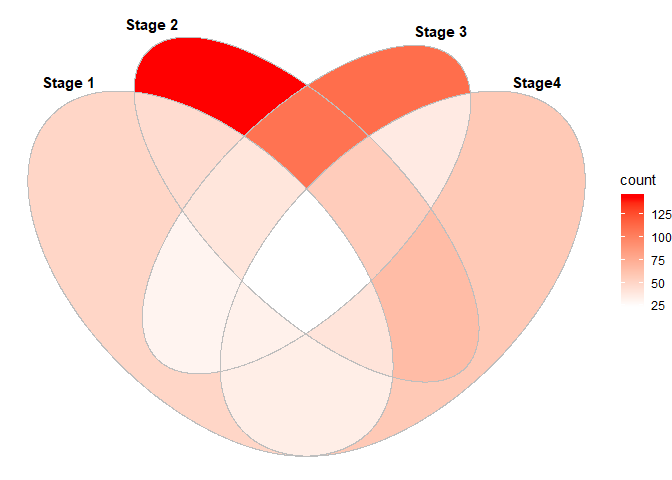
ggVennDiagram maps the fill color of each region to quantity, allowing us to visually observe the differences between different parts.
library(ggVennDiagram)
genes <- paste("gene",1:1000,sep="")
set.seed(20190708)
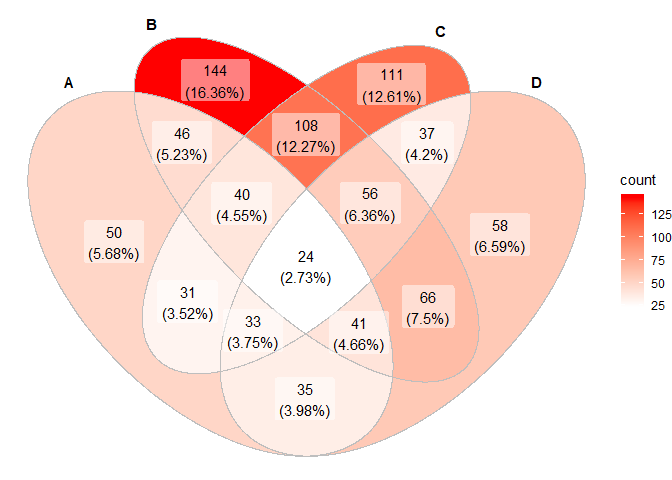
x <- list(A=sample(genes,300),B=sample(genes,525),C=sample(genes,440),D=sample(genes,350))
# four dimension venn plot
ggVennDiagram(x)

ggVennDiagram return a ggplot object, which can be further modified with ggplot functions.
library(ggplot2)
ggVennDiagram(x) + scale_fill_gradient(low="blue",high = "red")
#> Scale for 'fill' is already present. Adding another scale for 'fill',
#> which will replace the existing scale.
ggVennDiagram(x,lty="dashed",color="black",size=2) + scale_fill_gradient(low="white",high = "red")
#> Scale for 'fill' is already present. Adding another scale for 'fill',
#> which will replace the existing scale.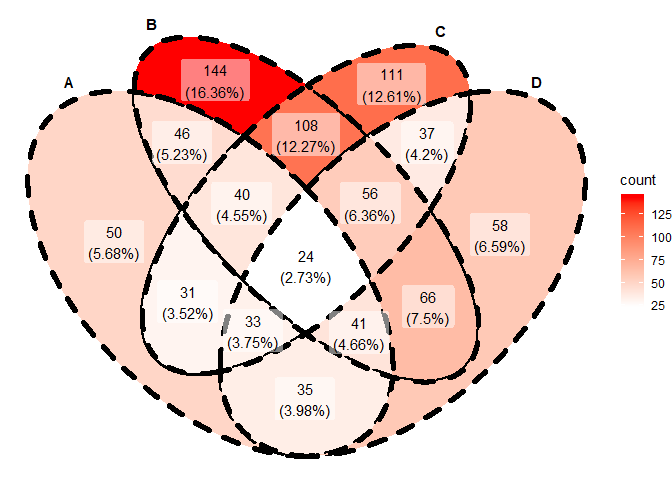
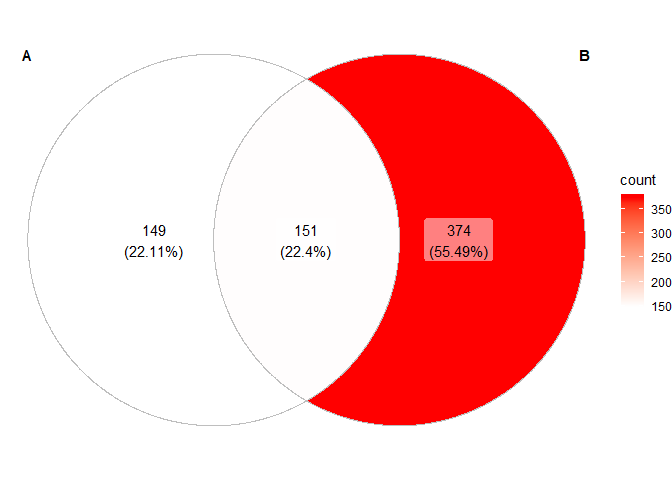
ggVennDiagram now support 2-4 dimension venn plot. The generated figure is generally ready for publish. The main function ggVennDiagram() will check how many items in the first paramenter and call corresponding function automatically.
The parameter category.names reprents set names. And the parameter label can label how many items are included in each parts.