
Simplifies Exploratory Data Analysis.
Faster insights with less code for experienced R users. Exploring a fresh new dataset is exciting. Instead of searching for syntax at Stackoverflow, use all your attention searching for interesting patterns in your data, using just a handful easy to remember functions. Your code is easy to understand - even for non R users.
Instant success for new R users. It is said that R has a steep learning curve, especially if you come from a GUI for your statistical analysis. Instead of learning a lot of R syntax before you can explore data, the explore package enables you to have instant success. You can start with just one function - explore() - and learn other R syntax later step by step.
There are three ways to use the package:
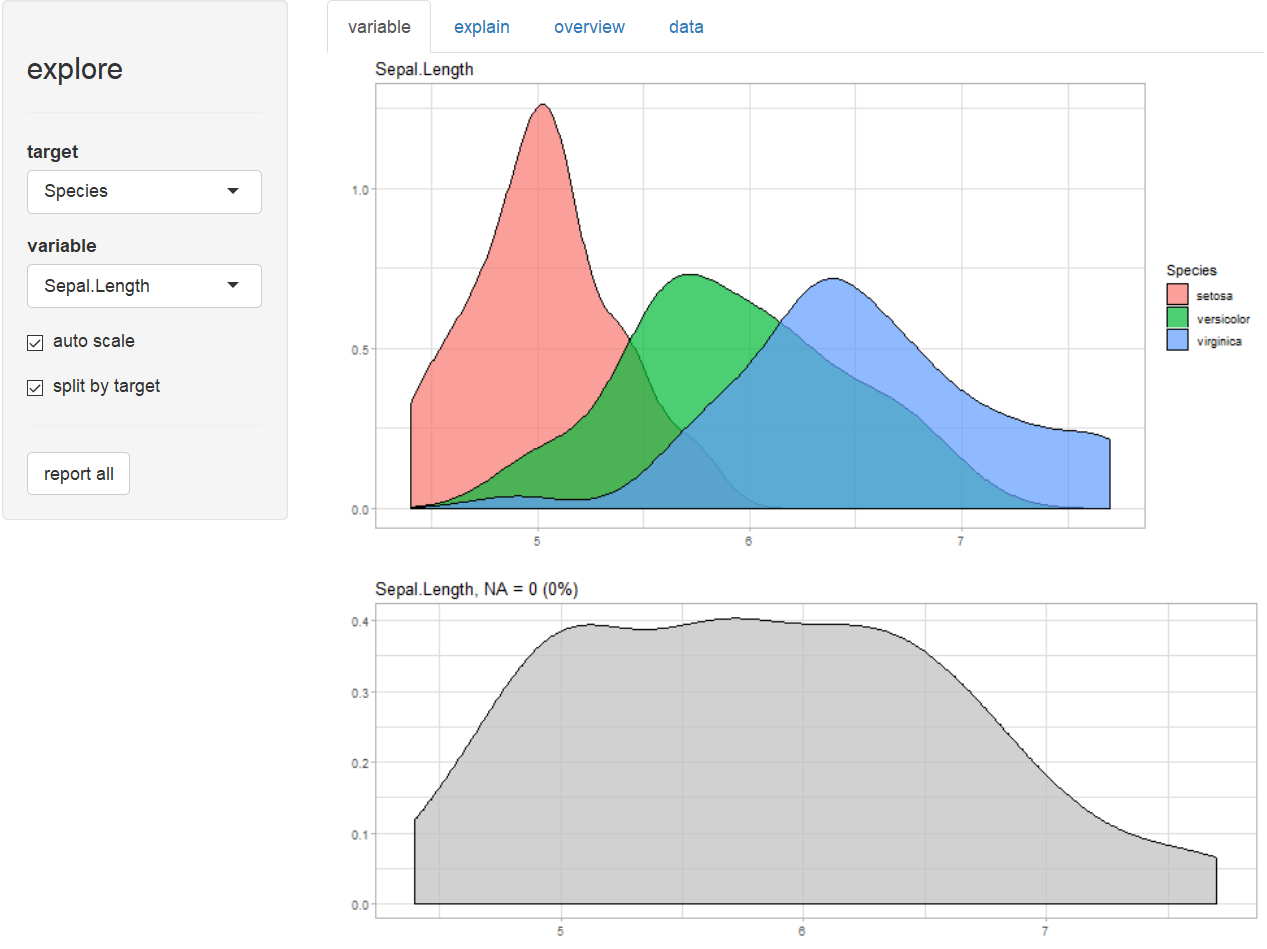
Interactive data exploration (univariat, bivariat, multivariat). A target can be defined (binary / categorical / numerical).
Generate an Automated Report with one line of code. The target can be binary, categorical or numeric.
Manual exploration using a easy to remember set of tidy functions. There are basically four “verbs” to remember:
explore - if you want to explore a table, a variable or the relationship between a variable and a target (binary, categorical or numeric). The output of these functions is a plot.
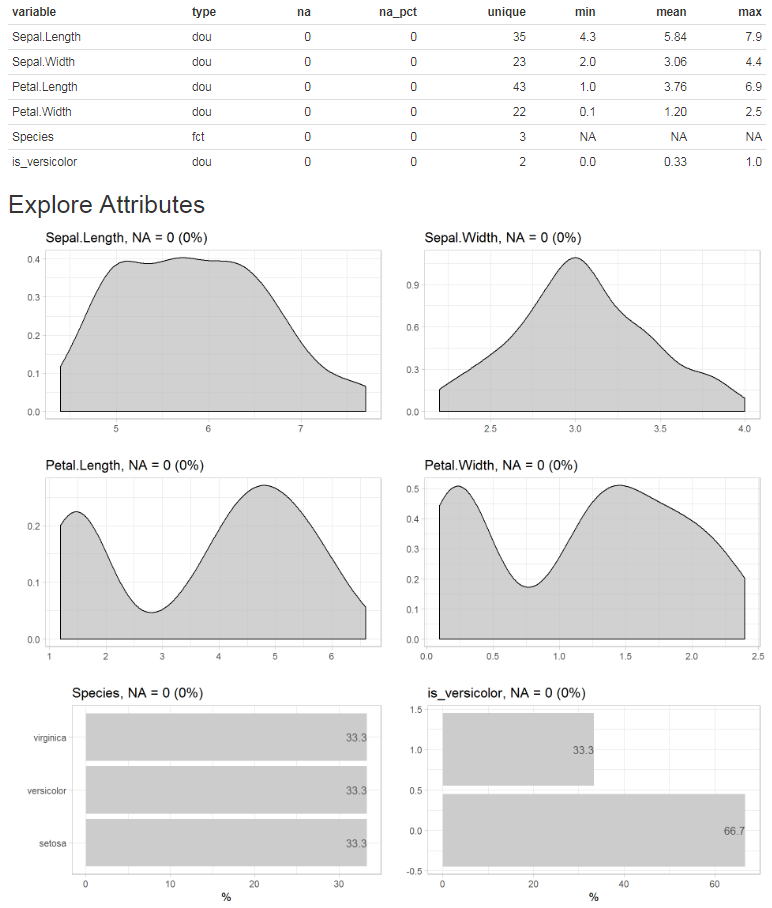
describe - if you want to describe a dataset or a variable (number of na, unique values, …) The output of these functions is a text.
explain - to create a simple model that explains a target. explain_tree() for a decision tree, explain_logreg() for a logistic regression.
report - to generate an automated report of all variables. A target can be defined (binary, categorical or numeric)
The explore package automatically checks if an attribute is categorial or numerical, chooses the best plot-type and handles outliers (autosacling).
To install the explore package on Debian / Ubuntu, you may need to install some additional dependencies first:
sudo apt install unixodbc unixodbc-dev
install.packages("odbc")
install.packages("explore")# install from github
if (!require(devtools)) install.packages("devtools")
devtools::install_github("rolkra/explore")if you are behind a firewall, you may want to:
# install local
if (!require(devtools)) install.packages("devtools")
devtools::install_local(path = <path of local package>, force = TRUE)Example how to use the explore package to explore the iris dataset
Explore variables
Explain target (is Species a versicolor?)
# define a target (is Species versicolor?)
iris$is_versicolor <- ifelse(iris$Species == "versicolor", 1, 0)
iris$Species <- NULL

# explore interactive
explore(iris)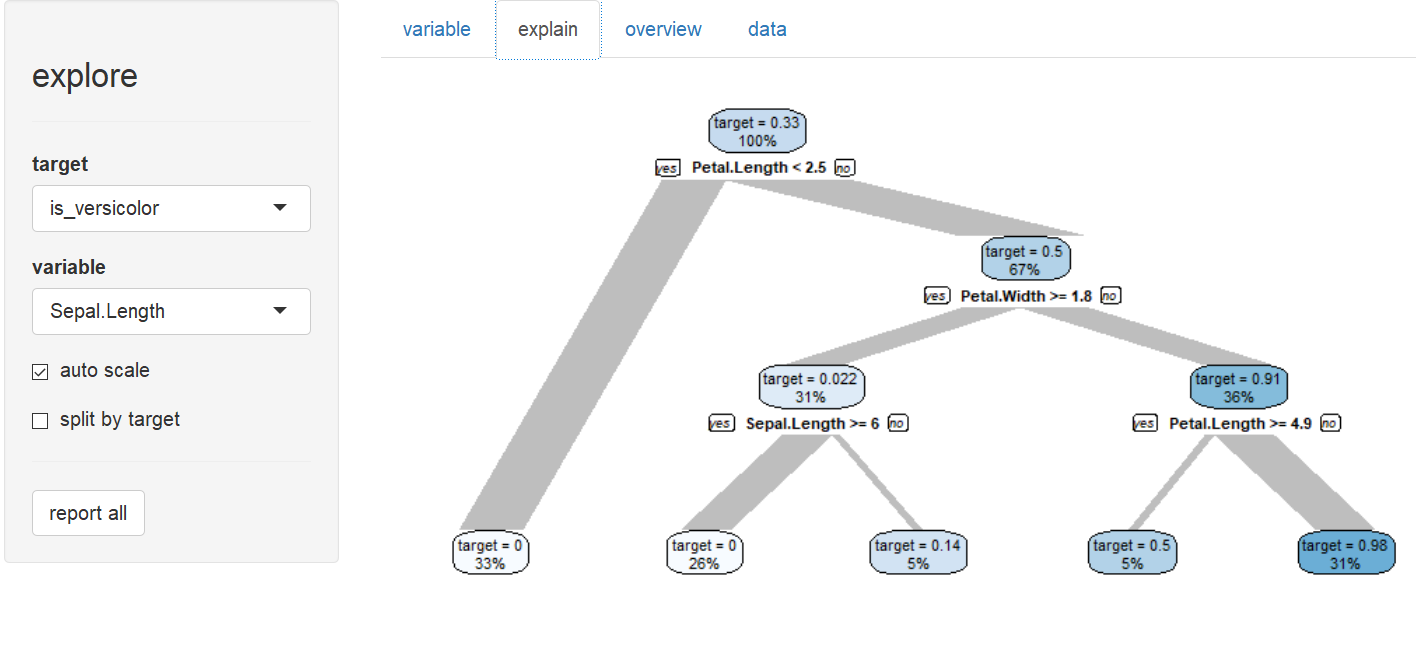
Create a report by clicking the “report all” button or use the report() function. If no target is defined, the report shows all variables. If a target is defined, the report shows the relation between all variables and the target.
Report of all variables
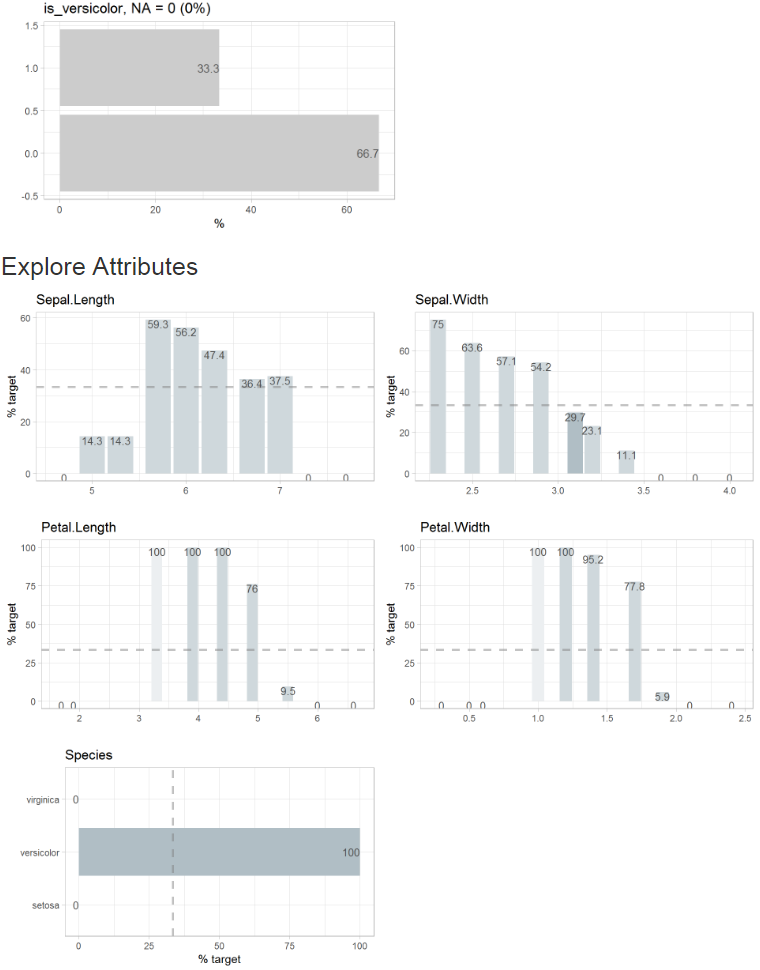
Report with defined target (binary target, split = FALSE)
Example how to use the functions of the explore package to explore the iris dataset
# load packages
library(explore)
library(magrittr)  # to use the pipe operator %>%

# use iris dataset
data(iris)

# explore Species
iris %>% explore(Species)

# explore Sepal.Length
iris %>% explore(Sepal.Length)

# define a target (is Species versicolor?)
iris$is_versicolor <- ifelse(iris$Species == "versicolor", 1, 0)

# explore relationship between Sepal.Length and the target
iris %>% explore(Sepal.Length, target = is_versicolor)

# explore relationship between all variables and the target
Iris %>% explore_all(target = is_versicolor)

# explore correlation between Sepal.Length and Petal.Length
iris %>% explore(Sepal.Length, Petal.Length)

# explore correlation between Sepal.Length, Petal.Length and a target
iris %>% explore(Sepal.Length, Petal.Length, target = is_versicolor)

# describe dataset
describe(iris)

# describe Species
iris %>% describe(Species)

# explain target using a decision tree
iris$Species <- NULL
iris %>% explain_tree(target = is_versicolor)

# explain target using a logistic regression
iris %>% explain_logreg(target = is_versicolor)