
![]()
EQ-5D is a popular health related quality of life instrument used in the clinical and economic evaluation of health care. Developed by the EuroQol group, the instrument consists of two components: health state description and evaluation.
For the description component a subject self-rates their health in terms of five dimensions; mobility, self-care, usual activities, pain/discomfort, and anxiety/depression using either a three-level (EQ-5D-3L) or a five-level (EQ-5D-5L) scale.
The evaluation component requires a patient to record their overall health status using a visual analogue scale (EQ-VAS).
Following assessment the scores from the descriptive component can be reported as a five digit number ranging from 11111 (full health) to 33333/55555 (worst health). However, frequently the scores on these five dimensions are converted to a single utility index using country specific value sets, which can be used in the clinical and economic evaluation of health care as well as in population health surveys.
The eq5d package provides methods to calculate index scores from a subject’s dimension scores, for both EQ-5D-3L and EQ-5D-5L value sets. Additionally, a Shiny app is included to enable the calculation, visualisation and automated statistical analysis of multiple EQ-5D index values via a web browser using EQ-5D dimension scores stored in CSV or Excel files.
Value sets for EQ-5D-3L are available for many countries and have been produced using the time trade-off (TTO) valuation technique or the visual analogue scale (VAS) valuation technique. Some countries have TTO and VAS value sets for EQ-5D-3L.
For EQ-5D-5L, a standardised valuation study protocol (EQ-VT) was developed by the EuroQol group based on the composite time trade-off (cTTO) valuation technique supplemented by a discrete choice experiment (DCE). The EuroQol group recommends users to use a standard value set where available.
The EQ-5D-5L “crosswalk” value sets published by van Hout et al are also included. The crosswalk value sets enable index values to be calculated for EQ-5D-5L data where no value set is available by mapping between the EQ-5D-5L and EQ-5D-3L descriptive systems.
Additional information on EQ-5D can be found on the EuroQol website as well as in Szende et al (2007) and Szende et al (2014). Advice on choosing a value set can also be found on the EuroQol website.
You can install the released version of eq5d from CRAN with:
And the development version from GitHub with:
library(eq5d)

#single calculation

#named vector MO, SC, UA, PD and AD represent mobility, self-care, usual activites, pain/discomfort and anxiety/depression, respectfully.
scores <- c(MO=1,SC=2,UA=3,PD=2,AD=1)

#EQ-5D-3L using the UK TTO value set
eq5d(scores=scores, country="UK", version="3L", type="TTO")
#> [1] 0.329

#Using five digit format
eq5d(scores=12321, country="UK", version="3L", type="TTO")
#> [1] 0.329

#multiple calculations using the Canadian VT value set

#data.frame with individual dimensions
scores.df <- data.frame(
  MO=c(1,2,3,4,5), SC=c(1,5,4,3,2), UA=c(1,5,2,3,1), PD=c(1,3,4,3,4), AD=c(1,2,1,2,1)
)

eq5d(scores.df, country="Canada", version="5L", type="VT")
#> [1] 0.949 0.362 0.390 0.524 0.431

#data.frame using five digit format
scores.df2 <- data.frame(state=c(11111,25532,34241,43332,52141))

eq5d(scores.df2, country="Canada", version="5L", type="VT", five.digit="state")
#> [1] 0.949 0.362 0.390 0.524 0.431

#or using a vector

eq5d(scores.df2$state, country="Canada", version="5L", type="VT")
#> [1] 0.949 0.362 0.390 0.524 0.431The available value sets can be viewed using the valuesets function. The results can be filtered by EQ-5D version, value set type or by country.
# Return all value sets (top 6 returned for brevity).
head(valuesets())
#>    Version Type   Country
#> 1 EQ-5D-3L  TTO Argentina
#> 2 EQ-5D-3L  TTO Australia
#> 3 EQ-5D-3L  TTO    Brazil
#> 4 EQ-5D-3L  TTO    Canada
#> 5 EQ-5D-3L  TTO     Chile
#> 6 EQ-5D-3L  TTO     China

# Return VAS based value sets (top 6 returned for brevity).
head(valuesets(type="VAS"))
#>    Version Type Country
#> 1 EQ-5D-3L  VAS Belgium
#> 2 EQ-5D-3L  VAS Denmark
#> 3 EQ-5D-3L  VAS  Europe
#> 4 EQ-5D-3L  VAS Finland
#> 5 EQ-5D-3L  VAS Germany
#> 6 EQ-5D-3L  VAS    Iran

# Return EQ-5D-5L value sets (top 6 returned for brevity).
head(valuesets(version="5L"))
#>    Version Type  Country
#> 1 EQ-5D-5L   VT   Canada
#> 2 EQ-5D-5L   VT    China
#> 3 EQ-5D-5L   VT  England
#> 4 EQ-5D-5L   VT Ethiopia
#> 5 EQ-5D-5L   VT   France
#> 6 EQ-5D-5L   VT  Germany

# Return all UK value sets.
valuesets(country="UK")
#>    Version Type Country
#> 1 EQ-5D-3L  TTO      UK
#> 2 EQ-5D-3L  VAS      UK
#> 3 EQ-5D-5L CW UKThe eq5dds function is an R approximation of the Stata command written by Ramos-Goñi & Ramallo-Fariña. The function analyses and summarises the descriptive components of an EQ-5D dataset. The “by” argument enables a grouping variable to be specified when analysing the data subgroup.
dat <- data.frame(
         matrix(
           sample(1:3,5*12, replace=TRUE),12,5,
           dimnames=list(1:12,c("MO","SC","UA","PD","AD"))
         ),
         Sex=rep(c("Male", "Female"))
       )

eq5dds(dat, version="3L")
#>     MO   SC   UA   PD   AD
#> 1 58.3 25.0 25.0 25.0  8.3
#> 2 41.7 41.7 41.7 41.7 41.7
#> 3  0.0 33.3 33.3 33.3 50.0

eq5dds(dat, version="3L", counts=TRUE)
#>   MO SC UA PD AD
#> 1  7  3  3  3  1
#> 2  5  5  5  5  5
#> 3  0  4  4  4  6

eq5dds(dat, version="3L", by="Sex")
#> data[, by]: Female
#>     MO   SC   UA   PD   AD
#> 1 33.3 33.3 33.3 33.3 16.7
#> 2 66.7 33.3  0.0 16.7 50.0
#> 3  0.0 33.3 66.7 50.0 33.3
#> ------------------------------------------------------------
#> data[, by]: Male
#>     MO   SC   UA   PD   AD
#> 1 83.3 16.7 16.7 16.7  0.0
#> 2 16.7 50.0 83.3 66.7 33.3
#> 3  0.0 33.3  0.0 16.7 66.7
Helper functions are included, which may be useful in the processing of EQ-5D data. getHealthStates returns a vector of all possible five digit health states for a specified EQ-5D version. splitHealthStates splits a vector of five digit health states into a data.frame of their individual components.
# Get all EQ-5D-3L five digit health states (top 6 returned for brevity).
head(getHealthStates("3L"))
#> [1] "11111" "11112" "11113" "11121" "11122" "11123"

# Split five digit health states into their individual components.
splitHealthStates(c("12345", "54321"), version="5L")
#>   MO SC UA PD AD
#> 1  1  2  3  4  5
#> 2  5  4  3  2  1
Example data is included with the package and can be accessed using the system.file function.
# View example files.
dir(path=system.file("extdata", package="eq5d"))
#> [1] "eq5d3l_example.xlsx" "eq5d3l_five_digit_example.xlsx"
#> [3] "eq5d5l_example.xlsx"
# Read example EQ-5D-3L data.
library(readxl)
data <- read_excel(system.file("extdata", "eq5d3l_example.xlsx", package="eq5d"))
# Calculate index scores
scores <- eq5d(data, country="UK", version="3L", type="TTO")
# Top 6 scores
head(scores)
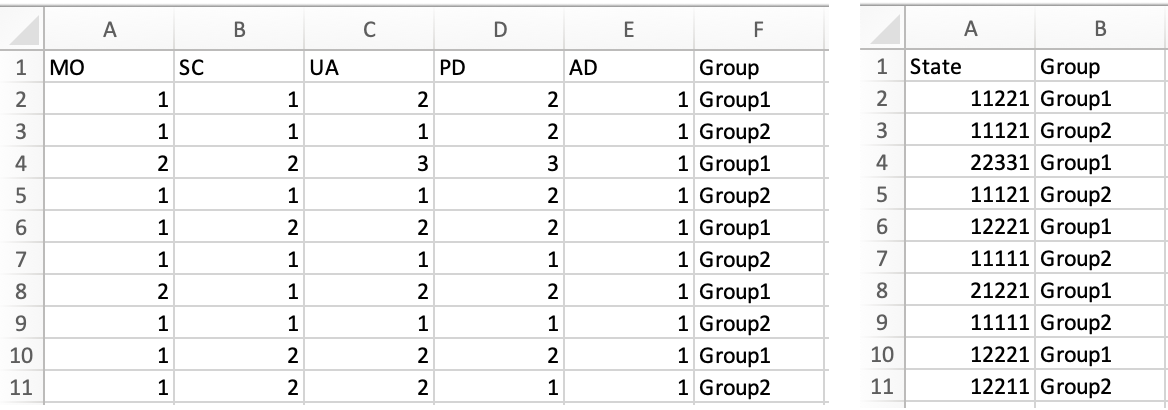
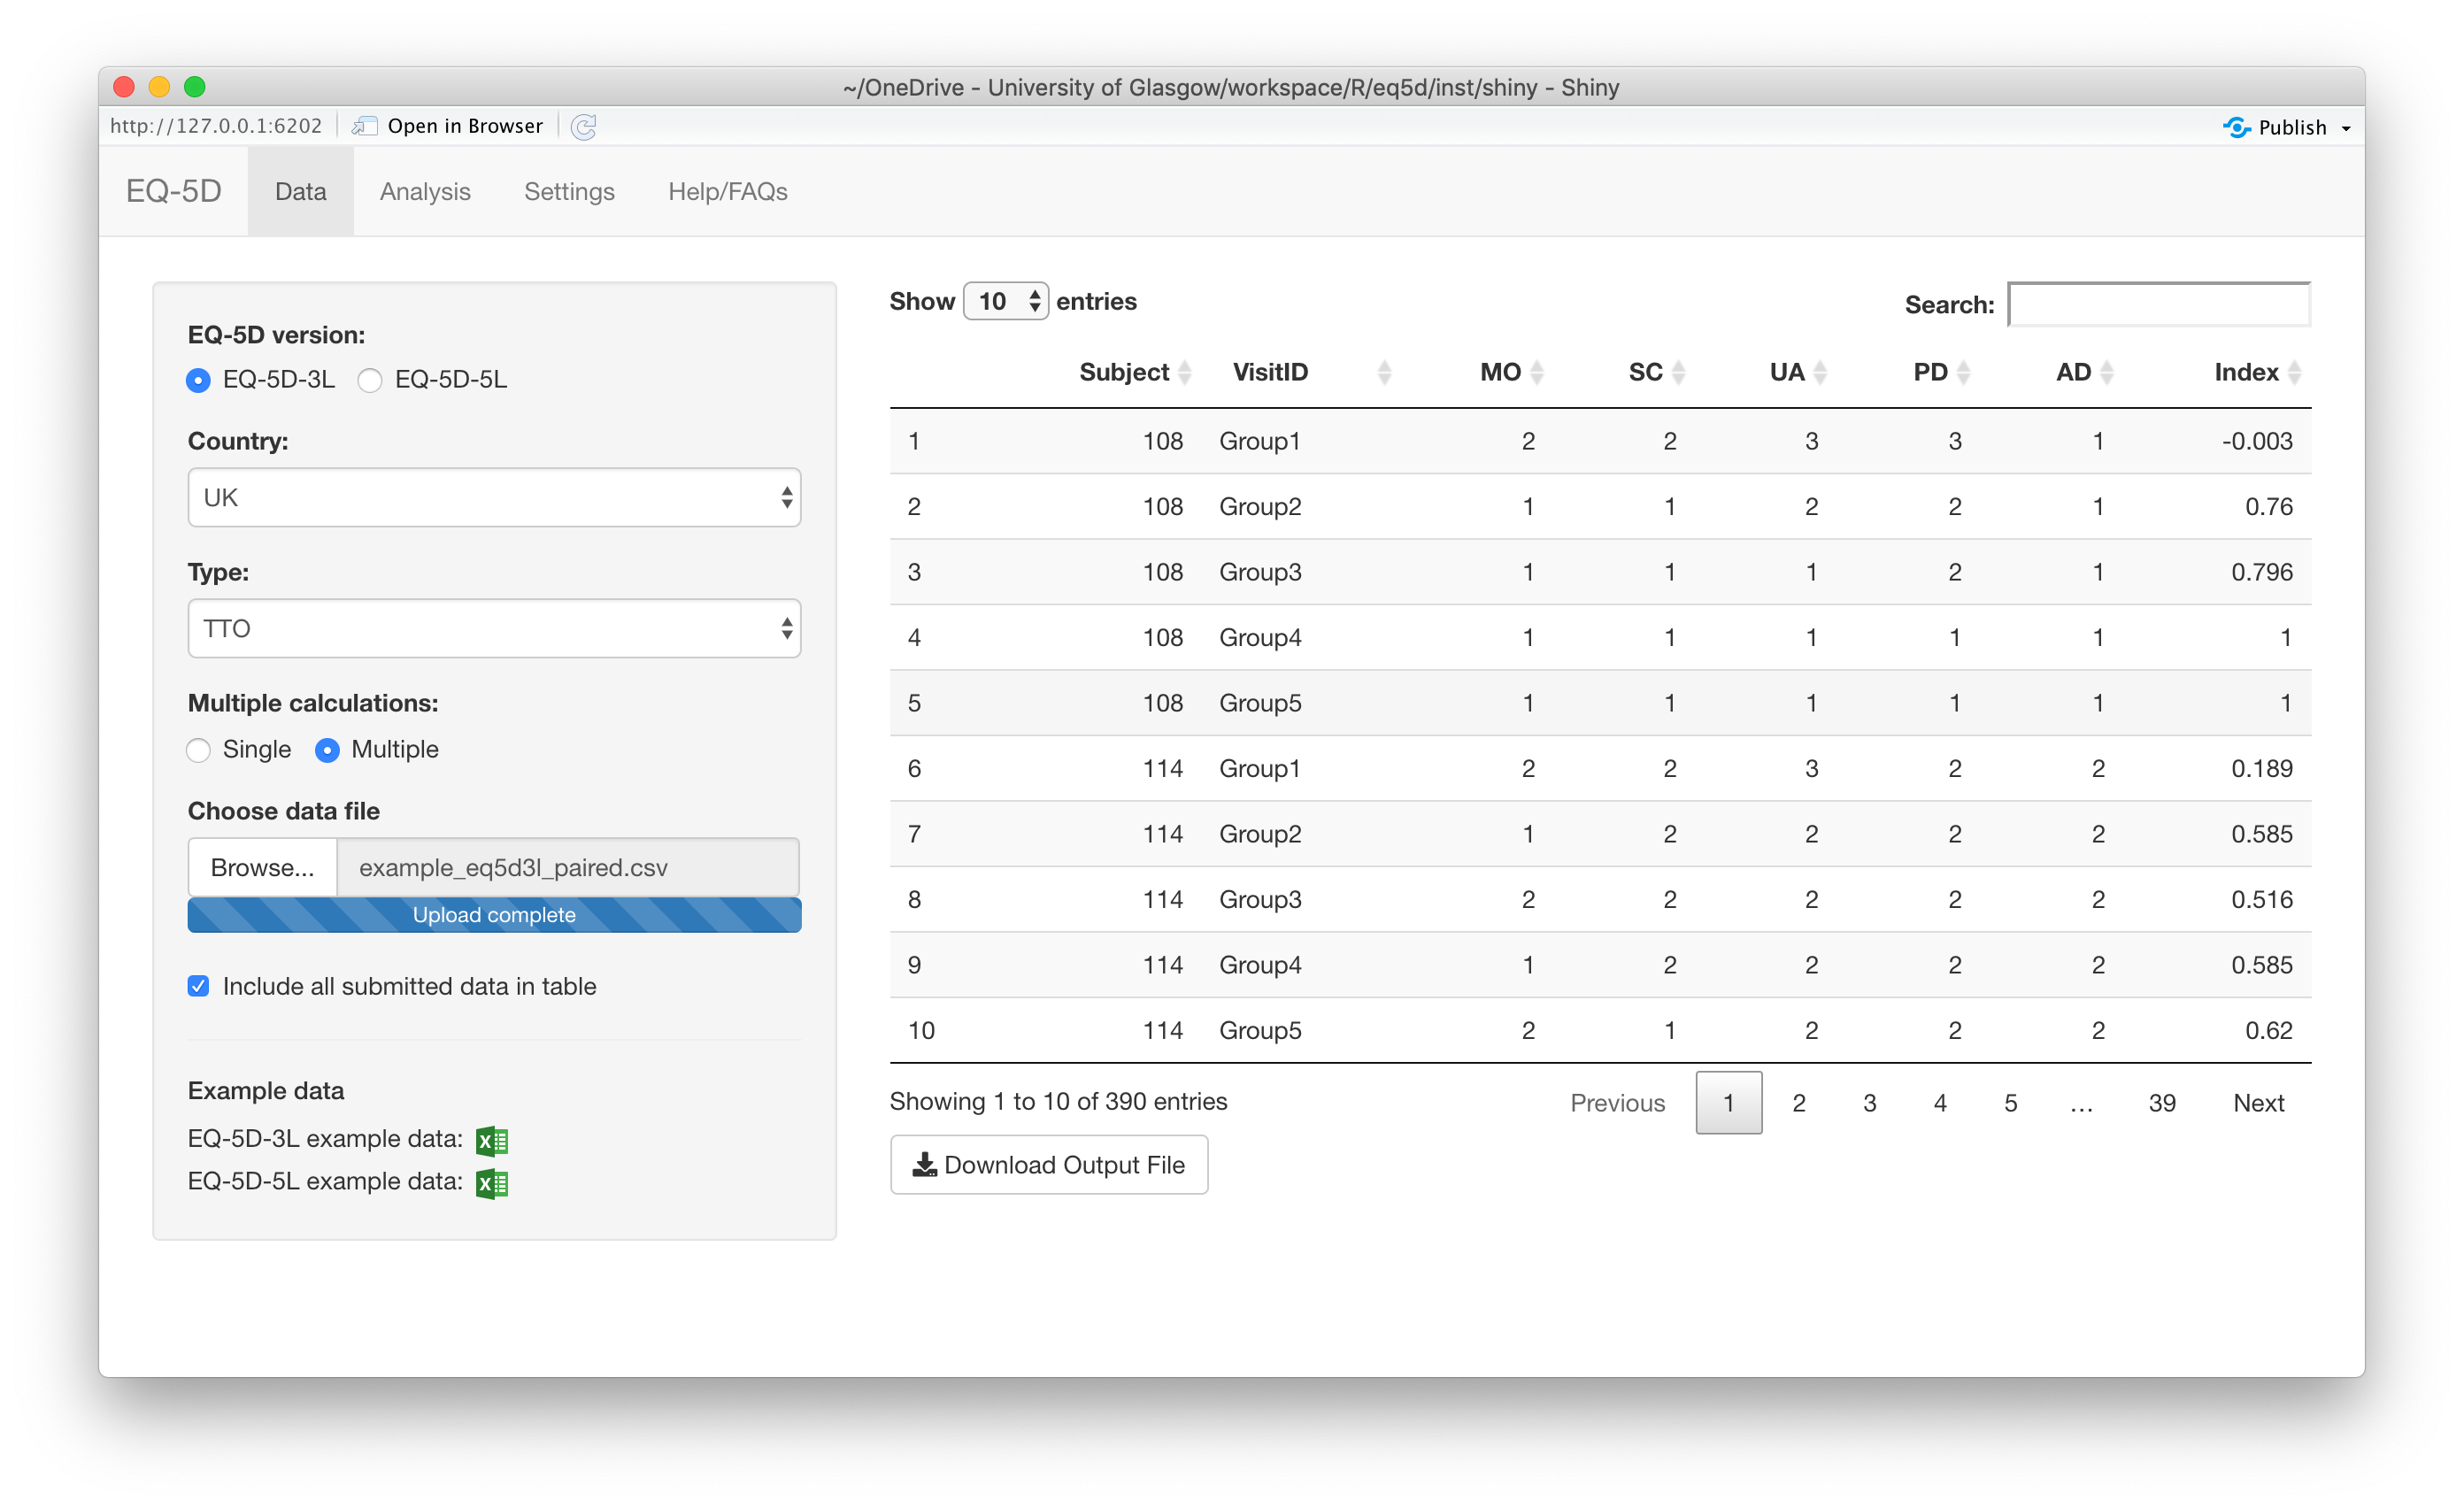
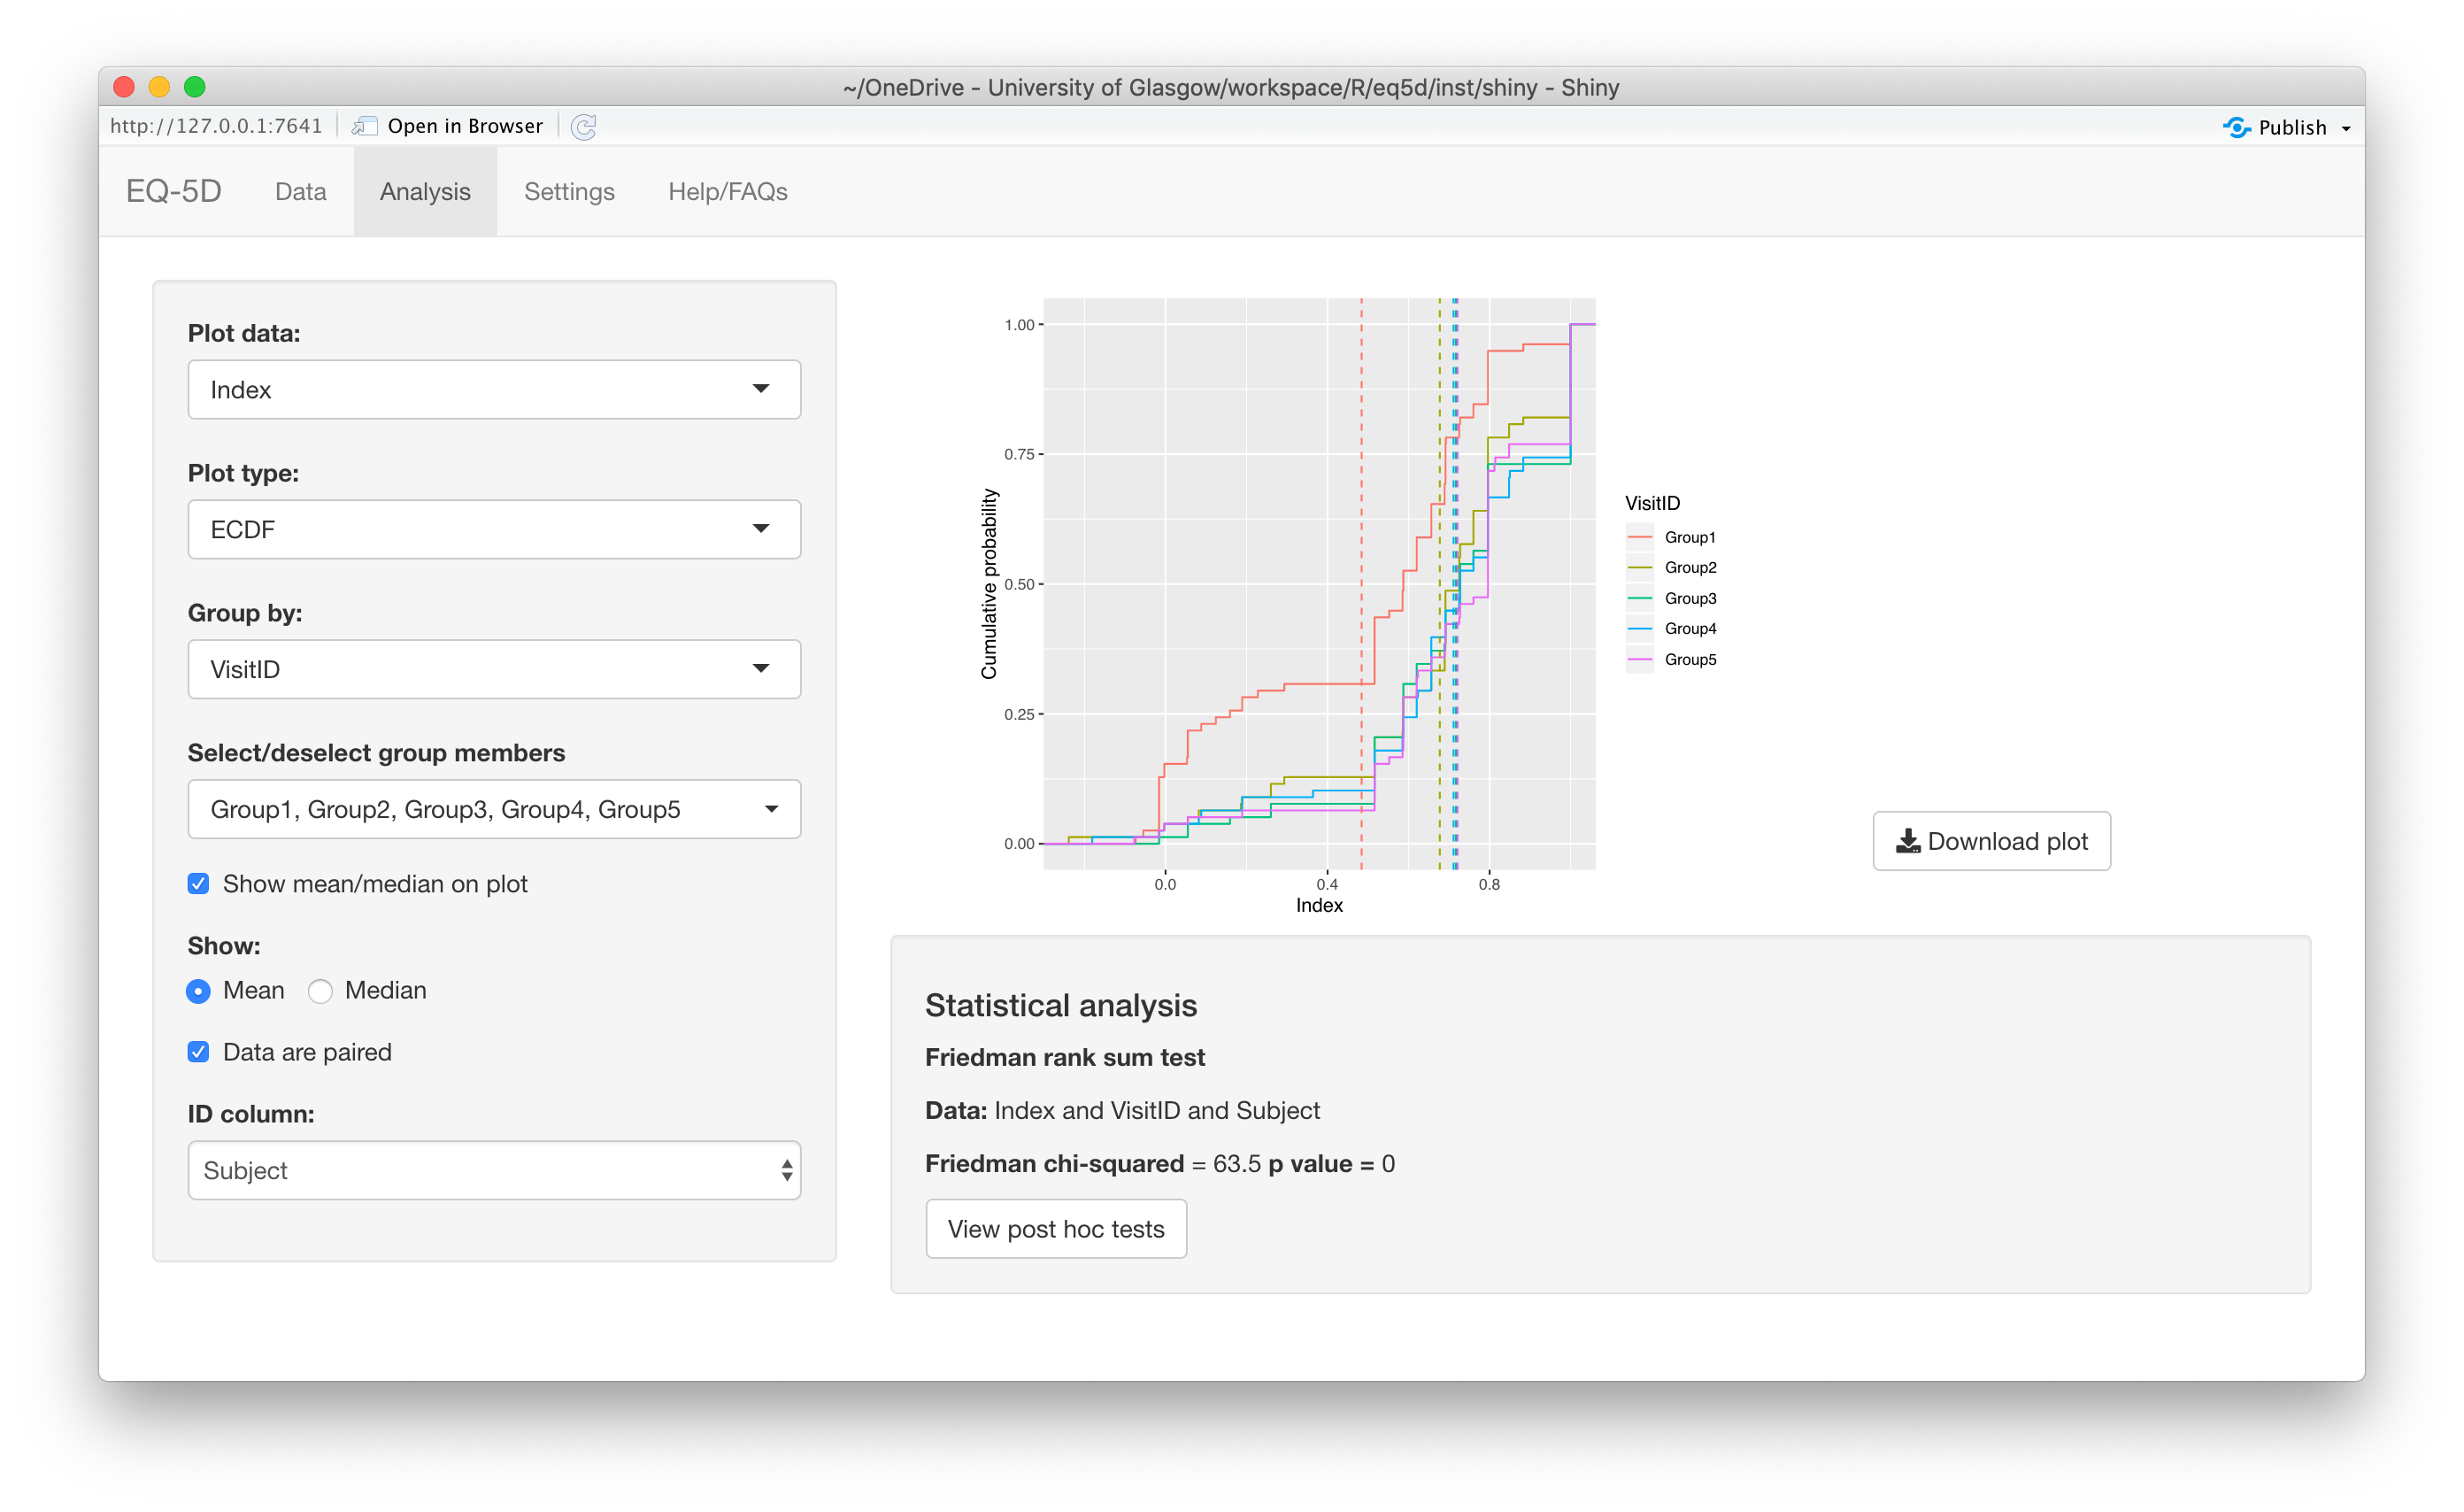
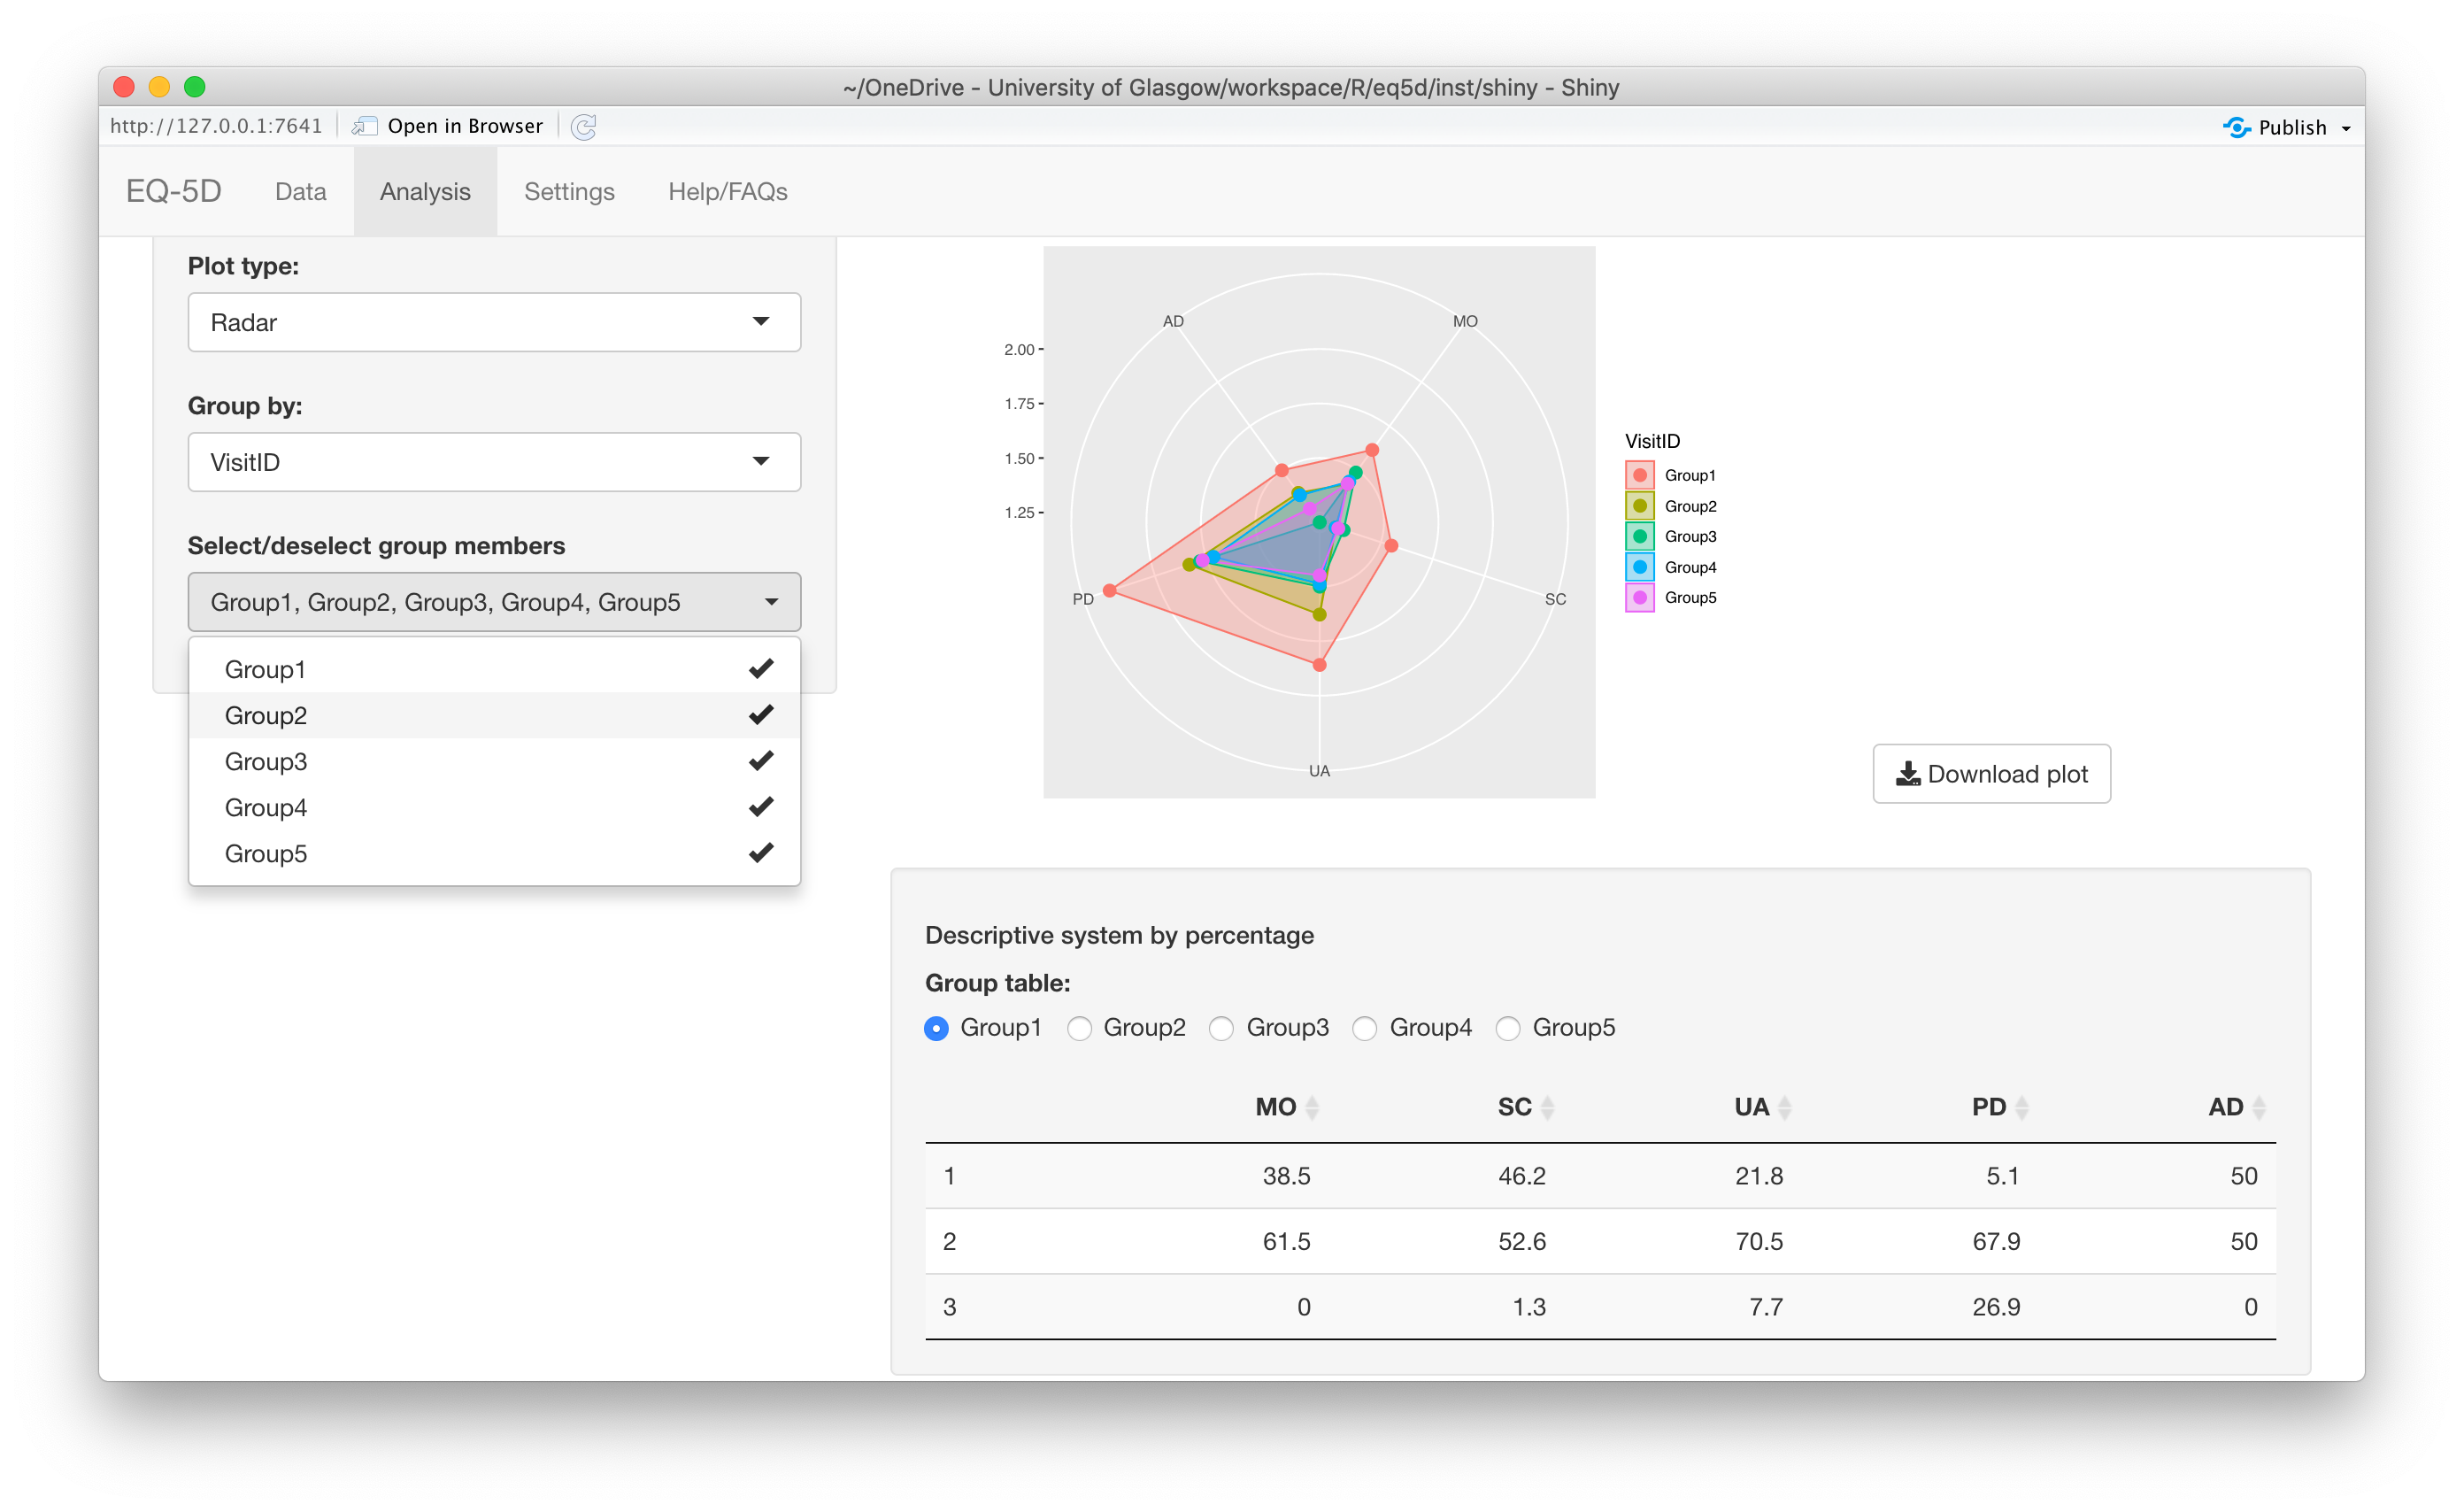
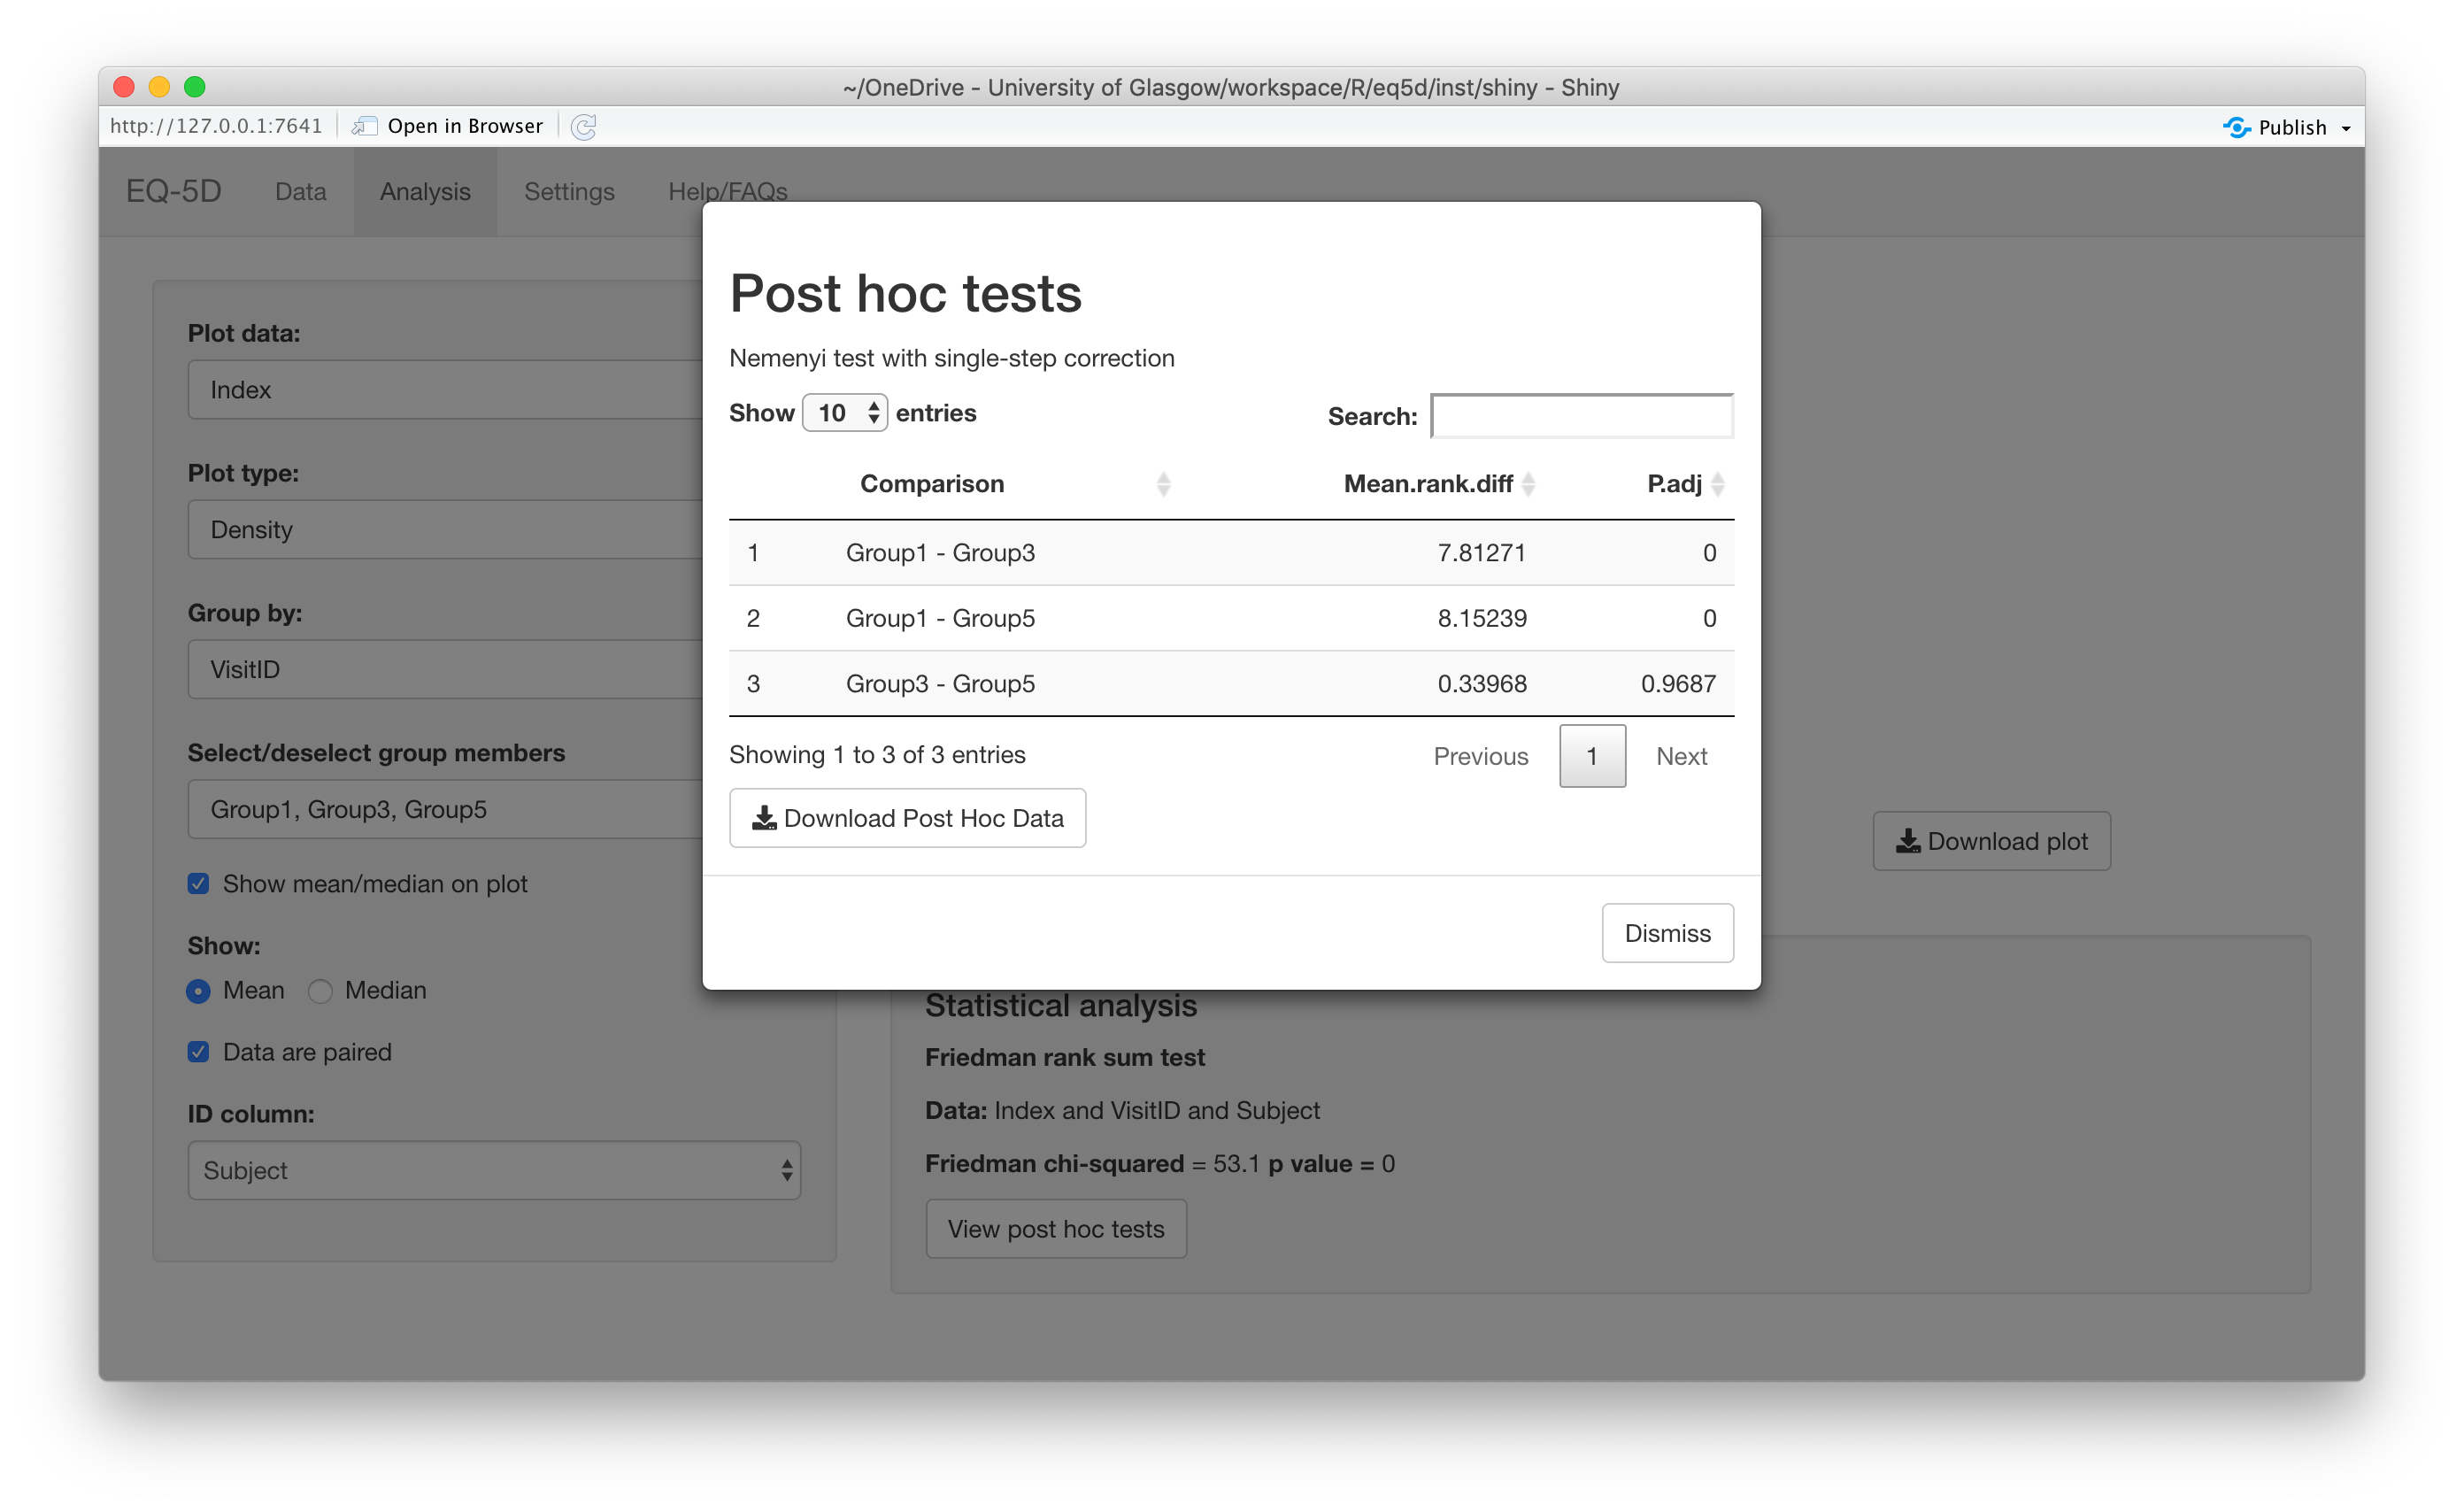
#> [1] 0.760 0.796 -0.003 0.796 0.656 1.000The calculation (and visualisation) of multiple EQ-5D indices can also be performed by upload of a CSV or Excel file using the packaged Shiny app. This requires the shiny, DT, FSA, ggplot2, ggiraph, ggiraphExtra, mime, PMCMRplus, readxl, shinycssloaders and shinyWidgets packages. Ideally the CSV/Excel headers should be the same as the names of the vector passed to the eq5d function i.e. MO, SC, UA, PD and AD or the column name “State” if using the five digit format. However, a modal dialog will prompt the user to select the appropriate columns if the defaults can not be found. Both files below will produce the same results.
The app is launched using the shiny_eq5d function.
Alternatively, it can be accessed without installing R/Shiny/eq5d by visiting shinyapps.io.
This project is licensed under the MIT License - see the LICENSE.md file for details.