![]()

The goal of epuR is to provide a simple and consistent framework to collect Economic Policy Uncertainty and related index data from their official web locations in real time. The official website of EPU is https://www.policyuncertainty.com/china_monthly.html.
You can install the released version of epuR from CRAN with:
And the development version from GitHub with:
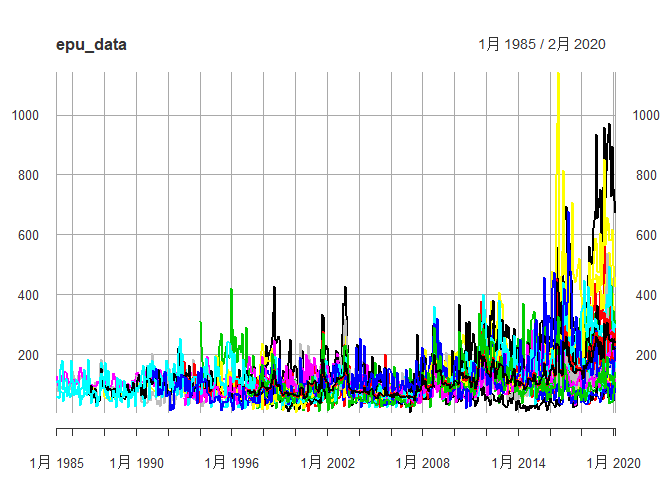
epuR functions adopts a get_XXX() style to collect the index data, where ‘XXX’ refers to the index name. For example, to get the Economic Policy Uncertainty (EPU) index, use function get_EPU():
Every get function returns an xts time series object so that further data manipulation and visualization is very straightforward if you are familiar with operations on xts. To plot all regions in the EPU data:
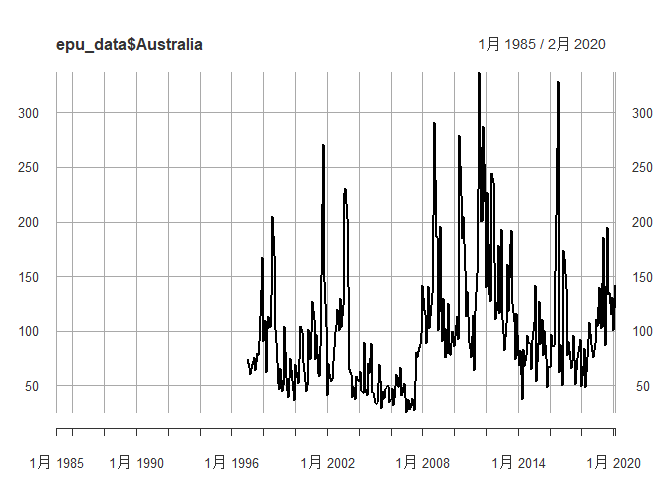
To plot some specific region:
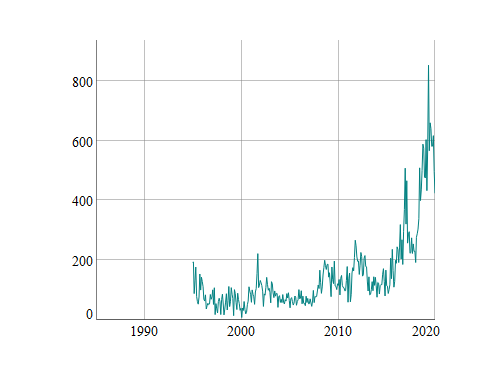
dygraphsdygraphs can be directly use to make the time series plot interactive:
Currently, the following indexes are supported:
| Function | Index Data | Default arguments |
|---|---|---|
get_EPU |
Economic Policy Uncertainty | region = “all” |
get_EMV |
Equity Market Volatility | all = T |
get_FSI |
Financial Stress Indicator | freq = “monthly” |
get_GPR |
Geopolitical Risk Index | type = 1 |
get_IRI |
Immigration Related Index | region = “all” |
get_TPU |
Trade Policy Uncertainty | region = “China” |
get_WUI |
World Uncertainty Index | type = “F1” |
get_OMI |
Oxford-Man Institute RV | index = “AEX” |
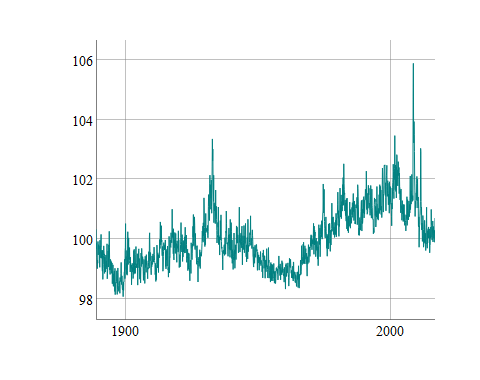
For example, to get the FSI data: