
![]()
emstreeR is a package for fast and easily computing Euclidean Minimum Spanning Trees (EMST). It heavily relies on ‘RcppMLPACK’ and ‘Rcpp’, working as a wrapper to the fast EMST Dual-Tree Boruvka algorithm (March, Ram, Gray, 2010) implemented in ‘mlpack’ - the C++ Machine Learning library (Curtin, 2013). Thus, do not have to deal with the R-‘Rcpp’-C++ integration. The package also provides functions and an S3 method for readily plotting Minimum Spanning Trees (MST) using either ‘base’ R, ‘scatterplot3d’ or ‘ggplot2’ style.
computeMST() computes an Euclidean Minimum Spanning Tree for the input data.plot.MST() an S3 method of the generic function plot() for plotting a 2D MST.plotMST3D() plots a 3D MST using the ‘scatterplot3d’ style.stat_MST() a ‘ggplot2’ Stat extension for plotting a 2D MST.# CRAN version
install.packages("emstreeR")
# Dev version
if (!require('devtools')) install.packages('devtools')
devtools::install_github("allanvc/emstreeR")## artificial data:
set.seed(1984)
n <- 7
c1 <- data.frame(x = rnorm(n, -0.2, sd = 0.2), y = rnorm(n, -2, sd = 0.2))
c2 <- data.frame(x = rnorm(n, -1.1, sd = 0.15), y = rnorm(n, -2, sd = 0.3))
d <- rbind(c1, c2)
d <- as.data.frame(d)
## MST:
library(emstreeR)
out <- ComputeMST(d)
#> 9 edges found so far.
#> 182 cumulative base cases.
#> 0 cumulative node combinations scored.
#> 12 edges found so far.
#> 332 cumulative base cases.
#> 0 cumulative node combinations scored.
#> 13 edges found so far.
#> 430 cumulative base cases.
#> 0 cumulative node combinations scored.
#> Total spanning tree length: 2.49929
out
#> x y from to distance
#> 1 -0.118159357 -2.166545 11 13 0.03281747
#> 2 -0.264604994 -2.105242 8 12 0.05703382
#> 3 -0.072829535 -1.716803 3 7 0.08060398
#> 4 -0.569225757 -1.943598 5 6 0.11944501
#> 5 -0.009270527 -1.942413 6 7 0.13450475
#> 6 0.037697969 -1.832590 8 10 0.14293342
#> 7 -0.091509110 -1.795213 1 2 0.15875908
#> 8 -1.097338236 -1.871078 10 14 0.16993335
#> 9 -0.841400898 -2.194585 1 5 0.24918237
#> 10 -1.081888729 -1.728982 8 13 0.27882008
#> 11 -1.366334073 -2.003965 2 4 0.34485145
#> 12 -1.081078171 -1.925745 9 12 0.36016689
#> 13 -1.357063682 -1.972485 4 9 0.37023475
#> 14 -0.913706515 -1.753315 1 1 0.00000000## artifical data for 2D plots:
set.seed(1984)
n <- 15
c1 <- data.frame(x = rnorm(n, -0.2, sd = 0.2), y = rnorm(n, -2, sd = 0.2))
c2 <- data.frame(x = rnorm(n, -1.1, sd = 0.15), y = rnorm(n, -2, sd = 0.3))
d <- rbind(c1, c2)
d <- as.data.frame(d)
## MST:
library(emstreeR)
out <- ComputeMST(d, verbose = FALSE)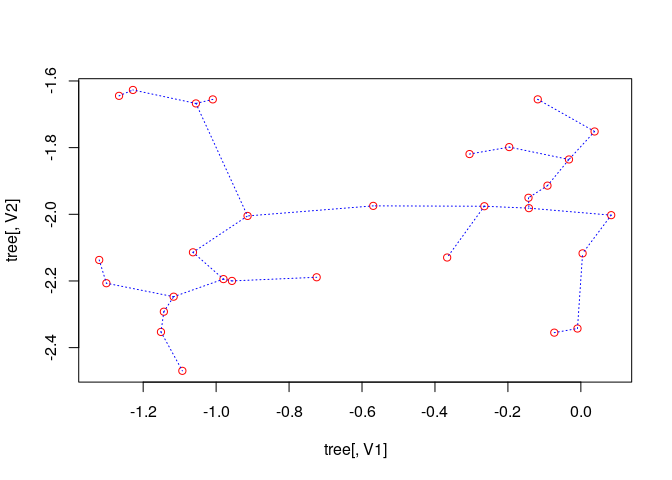
## 2D plot with ggplot2:
library(ggplot2)
ggplot(data = out, aes(x = x, y = y, from = from, to = to))+
  geom_point()+
  stat_MST(colour="red")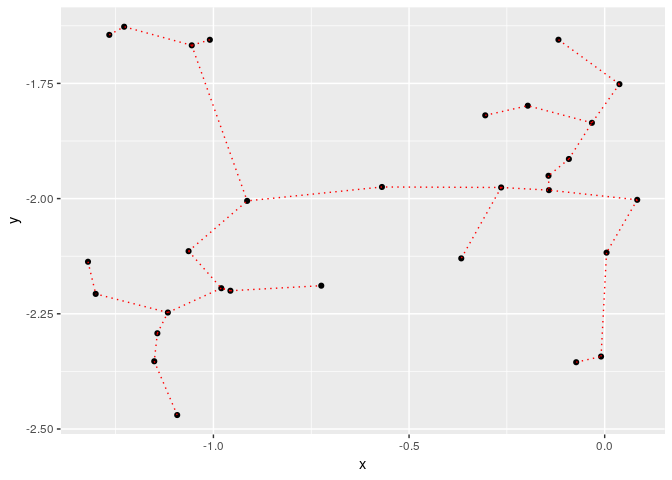
## 2D curved edges plot with ggplot2:
library(ggplot2)
ggplot(data = out, aes(x = x, y = y, from = from, to = to))+
  geom_point()+
  stat_MST(geom="curve")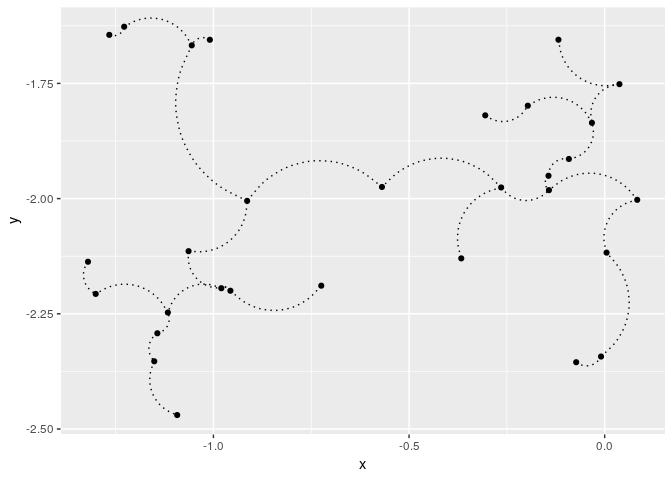
## artificial data for 3D plots:
n = 99
set.seed(1984)
d1 <- matrix(rnorm(n, mean = -2, sd = .5), n/3, 3) # 3d
d2 <- matrix(rnorm(n, mean = 0, sd = .3), n/3, 3)
d3 <- matrix(rnorm(n, mean = 3, sd = .4), n/3, 3)
d <- rbind(d1,d2,d3) # showing a matrix input

## MST:
library(emstreeR)
out <- ComputeMST(d, verbose = FALSE)
## simple 3D plot:
plotMST3D(out, xlab = "xaxis", col.pts = "orange", col.segts = "red", main = "a simple MST 3D plot")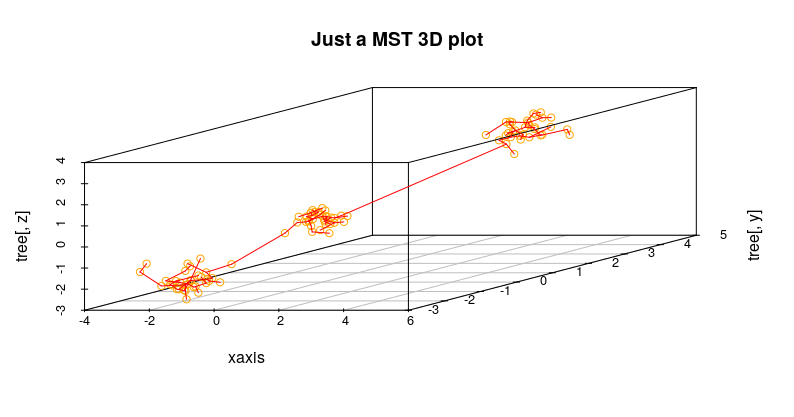
This package is licensed under the terms of the BSD 3-clause License.
March, W. B., and Ram, P., and Gray, A. G. (2010). Fast euclidian minimum spanning tree: algorithm analysis, and applications. 16th ACM SIGKDD International Conference on Knowledge Discovery and Data mining, July 25-28 2010. Washington, DC, USA.
Curtin, R. R. et al. (2013). Mlpack: A scalable C++ machine learning library. Journal of Machine Learning Research, v. 14, 2013.