
![]()
An Implementation of Hastie and Tibshirani’s Discriminant Adaptive Nearest Neighbor Classification in R.
You can install the released version of dann from CRAN with:
And the development version from GitHub with:
DANN is a variation of k nearest neighbors where the shape of the neighborhood takes into account training data’s class. The neighborhood is elongated along class boundaries and shrunk in the orthogonal direction to class boundaries. See Discriminate Adaptive Nearest Neighbor Classification by Hastie and Tibshirani. This package implements DANN and sub-DANN in section 4.1 of the publication and is based on Christopher Jenness’s python implementation.
library(dann)
library(dplyr, warn.conflicts = FALSE)
library(ggplot2)
library(mlbench)

set.seed(1)

#Create training data
train <- mlbench.circle(500, 2) %>%
  tibble::as_tibble()
colnames(train) <- c("X1", "X2", "Y")

ggplot(train, aes(x = X1, y = X2, colour = Y)) +
  geom_point() +
  labs(title = "Train Data")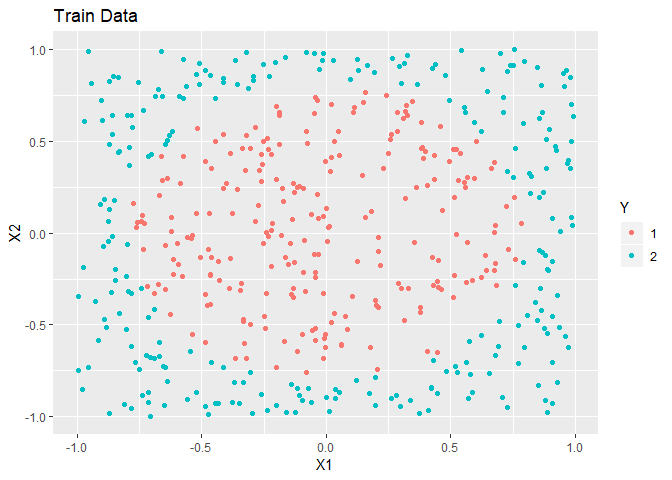
xTrain <- train %>%
  select(X1, X2) %>%
  as.matrix()

yTrain <- train %>%
  pull(Y) %>%
  as.numeric() %>%
  as.vector()

#Create test data
test <- mlbench.circle(500, 2) %>%
  tibble::as_tibble()
colnames(test) <- c("X1", "X2", "Y")

ggplot(test, aes(x = X1, y = X2, colour = Y)) +
  geom_point() +
  labs(title = "Test Data")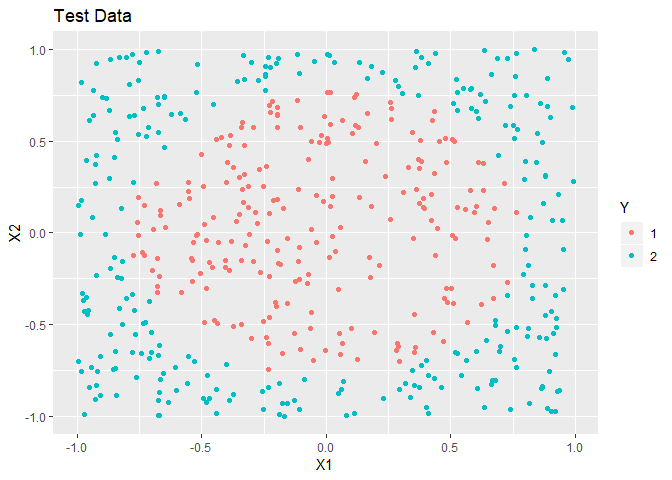
xTest <- test %>%
  select(X1, X2) %>%
  as.matrix()

yTest <- test %>%
  pull(Y) %>%
  as.numeric() %>%
  as.vector()

# Train and predict using dann from elements of statistical learning.
dannPreds <- dann(xTrain = xTrain, yTrain = yTrain, xTest = xTest,
                  k = 7, neighborhood_size = 50, epsilon = 1)
mean(dannPreds == yTest)
#> [1] 0.964
set.seed(1)
train <- mlbench.2dnormals(1000, cl = 2, r = sqrt(2), sd = .2) %>%
  tibble::as_tibble()
colnames(train) <- c("X1", "X2", "Y")

ggplot(train, aes(x = X1, y = X2, colour = Y)) +
  geom_point() +
  labs(title = "Train Data")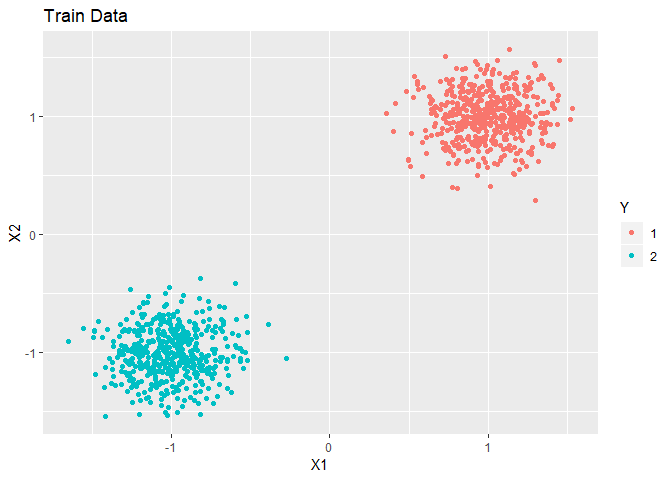
xTrain <- train %>%
  select(X1, X2) %>%
  as.matrix()

yTrain <- train %>%
  pull(Y) %>%
  as.numeric() %>%
  as.vector()

test <- mlbench.2dnormals(1000, cl = 2, r = sqrt(2), sd = .2) %>%
  tibble::as_tibble()
colnames(test) <- c("X1", "X2", "Y")

ggplot(test, aes(x = X1, y = X2, colour = Y)) +
  geom_point() +
  labs(title = "Test Data")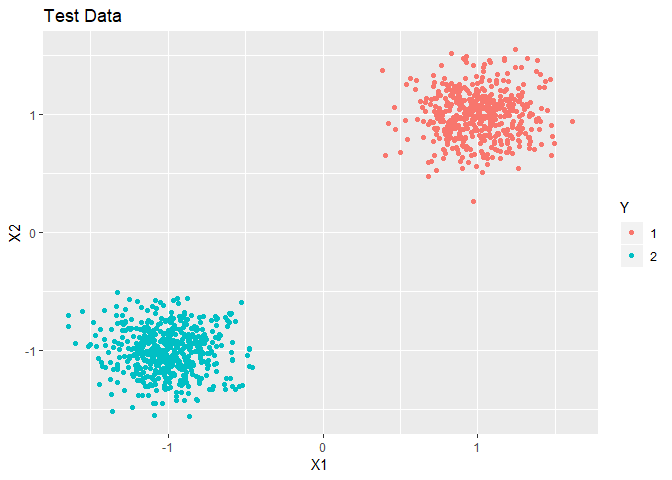
xTest <- test %>%
  select(X1, X2) %>%
  as.matrix()

yTest <- test %>%
  pull(Y) %>%
  as.numeric() %>%
  as.vector()

# Train and predict using dann from elements of statistical learning.
dannPreds <- dann(xTrain = xTrain, yTrain = yTrain, xTest = xTest,
                  k = 5, neighborhood_size = 50, epsilon = 1)

mean(dannPreds == yTest)
#> [1] 1