![]()
The covid19nytimes package harvests the data made freely available by the New York Times. See https://www.nytimes.com/article/coronavirus-county-data-us.html for more.
You can install the released version of covid19nytimes from CRAN with:
Or the latest development version from github
The package has the data from states and counties. The package comes with static data that was downloaded at the time of the last package update.
| date | location | location_type | location_code | location_code_type | data_type | value |
|---|---|---|---|---|---|---|
| 2020-04-12 | Alabama | state | 01 | fips_code | cases_total | 3583 |
| 2020-04-12 | Alabama | state | 01 | fips_code | deaths_total | 93 |
| 2020-04-12 | Alaska | state | 02 | fips_code | cases_total | 270 |
| 2020-04-12 | Alaska | state | 02 | fips_code | deaths_total | 6 |
| 2020-04-12 | American Samoa | state | 60 | fips_code | cases_total | 0 |
| 2020-04-12 | American Samoa | state | 60 | fips_code | deaths_total | 0 |
| date | location | location_type | location_code | location_code_type | data_type | value |
|---|---|---|---|---|---|---|
| 2020-04-12 | Abbeville,South Carolina | county_state | 45001 | fips_code | cases_total | 9 |
| 2020-04-12 | Abbeville,South Carolina | county_state | 45001 | fips_code | deaths_total | 0 |
| 2020-04-12 | Acadia,Louisiana | county_state | 22001 | fips_code | cases_total | 99 |
| 2020-04-12 | Acadia,Louisiana | county_state | 22001 | fips_code | deaths_total | 5 |
| 2020-04-12 | Accomack,Virginia | county_state | 51001 | fips_code | cases_total | 15 |
| 2020-04-12 | Accomack,Virginia | county_state | 51001 | fips_code | deaths_total | 0 |
To get the most updated data, run the following functions
covid19nytimes_states <- refresh_covid19nytimes_states()

covid19nytimes_counties <- refresh_covid19nytimes_counties()The data follows the covid19R standard for tidy Covid-19 data. The data columns are as follows:
,, and can be split by tidyr::separate(), if you wish.fips_codetotal_cases and total_deaths, cumulative measures of both.library(dplyr)
#>
#> Attaching package: 'dplyr'
#> The following objects are masked from 'package:stats':
#>
#> filter, lag
#> The following objects are masked from 'package:base':
#>
#> intersect, setdiff, setequal, union
library(ggplot2)
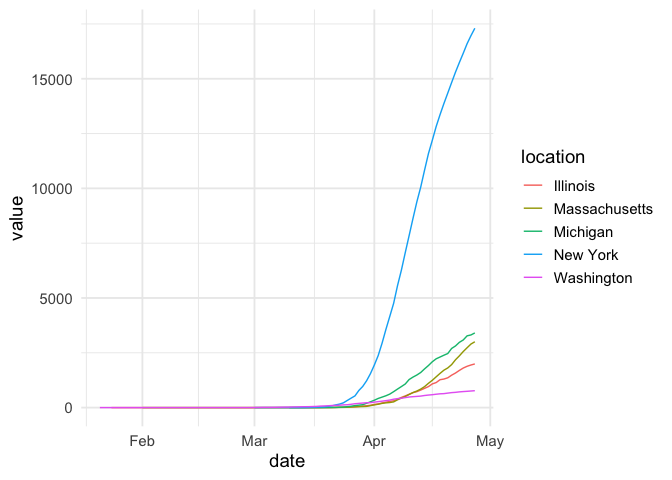
covid19nytimes_states %>%
filter(location %in% c("Washington", "New York", "Massachusetts", "Michigan", "Illinois")) %>%
filter(data_type == "deaths_total") %>%
ggplot(aes(x = date, y = value, color = location)) +
geom_line() +
theme_minimal(base_size=14) +
scale_y_continuous()