colorfulVennPlot: Plot and add custom coloring to Venn diagrams for 2-dimensional,
3-dimensional and 4-dimensional data
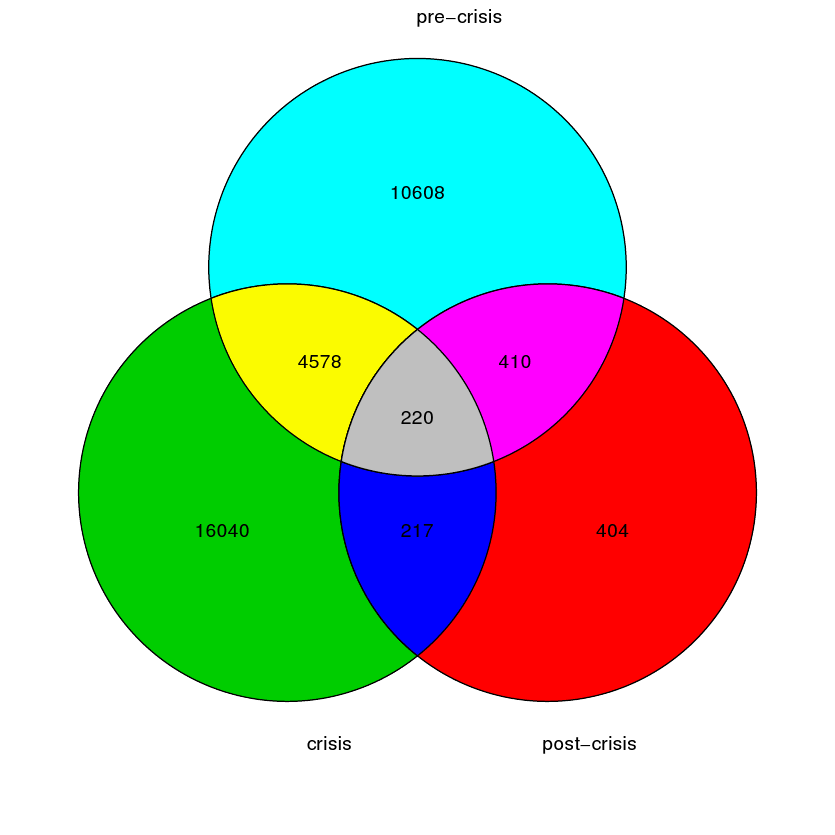
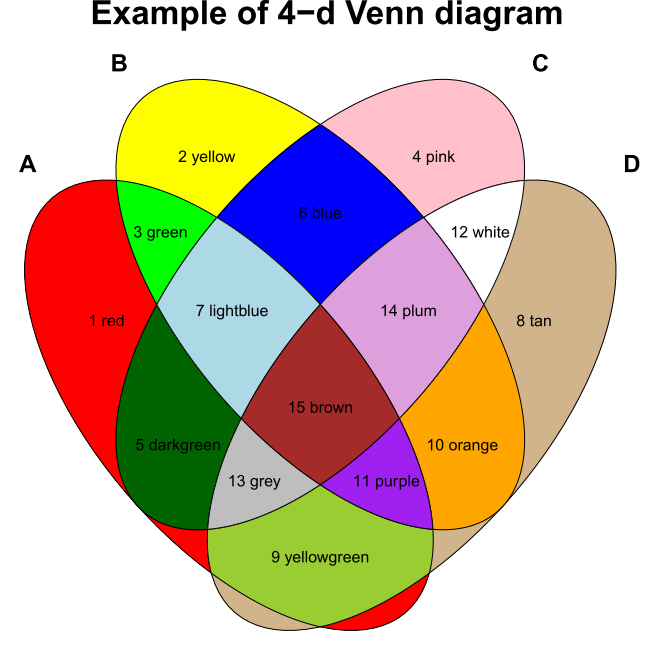
Given 2-,3- or 4-dimensional data, plots a Venn diagram, i.e. 'crossing circles'. The user can specify values, labels for each circle-group and unique colors for each plotted part. Here is what it would look like for a 3-dimensional plot: http://elliotnoma.files.wordpress.com/2011/02/venndiagram.png. To see what the 4-dimensional plot looks like, go to http://elliotnoma.files.wordpress.com/2013/03/4dplot.png.
| Version: |
2.4 |
| Depends: |
grid |
| Suggests: |
MASS |
| Published: |
2013-11-12 |
| Author: |
Elliot Noma, Aliona Manvae |
| Maintainer: |
Elliot Noma <noma at garrettassetmanagement.com> |
| License: |
GPL-2 |
| NeedsCompilation: |
no |
| CRAN checks: |
colorfulVennPlot results |
Downloads:
Reverse dependencies:
Linking:
Please use the canonical form
https://CRAN.R-project.org/package=colorfulVennPlot
to link to this page.