![]()
bioRad provides standardized methods for extracting and reporting biological signals from weather radars. It includes functionality to inspect low-level radar data, process these data into meaningful biological information on animal speeds and directions at different altitudes in the atmosphere, visualize these biological extractions, and calculate further summary statistics.
To get started, see:
More vignettes:
Documentation for the latest development version can be found here.
bioRad depends on packages from both the CRAN and Bioconductor repositories. Enable both with:
Required system libraries on Linux (Ubuntu)
The following system libraries are required before installing bioRad on Linux systems. In terminal, install these with:
sudo apt install libcurl4-openssl-dev
sudo apt install libssl-dev
sudo apt install libgdal-dev
You can install the released version of bioRad from CRAN with:
Alternatively, you can install the latest development version from GitHub with:
Then load the package with:
library(bioRad)
#> Welcome to bioRad version 0.5.2
#> Docker daemon running, Docker functionality enabled (vol2bird version 0.5.0, MistNet available)You need to install Docker to:
calculate_vp().read_pvolfile(). Docker is not required for reading ODIM radar data.nexrad_to_odim().calculate_vp() or apply_mistnet()Why? bioRad makes use of a C implementation of the vol2bird algorithm through Docker to do the above. All other bioRad functions will work without a Docker installation.
Installing Docker
Settings > Shared drives > Select the drive(s) where you will be processing radar files > Click Apply.Preferences > File sharing > Add the drive(s) where you will be processing radar files > Click Apply & Restart.check_docker().Known issues with Docker
Got permission denied while trying to connect to the Docker daemon socket at unix:///var/run/docker.sock, see this solution. Running sudo usermod -a -G docker $USER in a terminal will fix this problem.bioRad can read weather radar data (= polar volumes) in the ODIM format and formats supported by the RSL library, such as NEXRAD data. NEXRAD data (US) are available as open data and on AWS.
Here we read an example polar volume data file with read_pvolfile(), extract the scan/sweep at elevation angle 3 with get_scan(), project the data to a plan position indicator with project_as_ppi() and plot the radial velocity of detected targets with plot():
library(tidyverse) # To pipe %>% the steps below
system.file("extdata", "volume.h5", package = "bioRad") %>%
  read_pvolfile() %>%
  get_scan(3) %>%
  project_as_ppi() %>%
  plot(param = "VRADH") # VRADH = radial velocity in m/s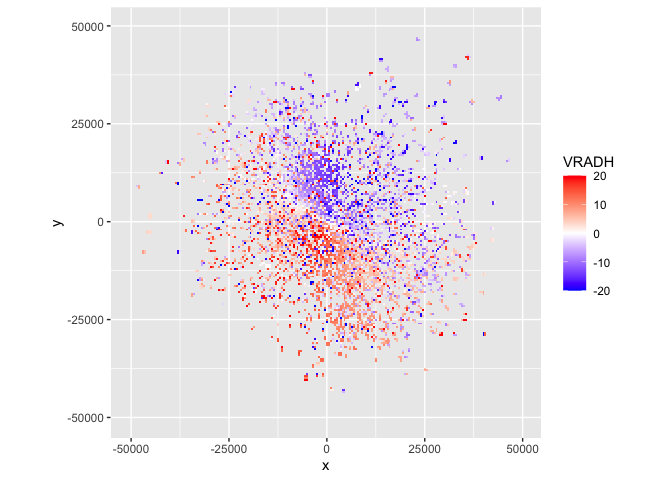
Radial velocities towards the radar are negative, while radial velocities away from the radar are positive, so in this plot there is movement from the top right to the bottom left.
Weather radar data can be processed into vertical profiles of biological targets using calculate_vp(). This type of data is available as open data for over 100 European weather radars.
Once vertical profile data are loaded into bioRad, these can be bound into time series using bind_into_vpts(). Here we read an example time series, project it on a regular time grid with regularize_vpts() and plot it with plot():
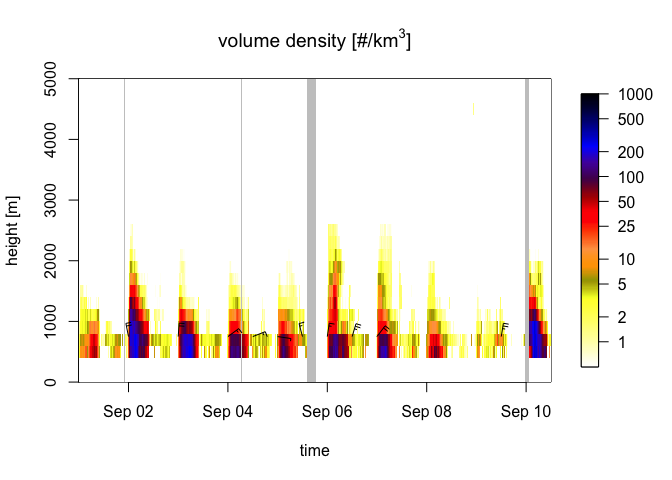
The gray bars in the plot indicate gaps in the data.
The altitudes in the profile can be integrated with integrate_profile() resulting in a dataframe with rows for datetimes and columns for quantities. Here we plot the quantity migration traffic rate (column mtr) with plot():
my_vpi <- integrate_profile(example_vpts)

plot(my_vpi, quantity = "mtr") # mtr = migration traffic rate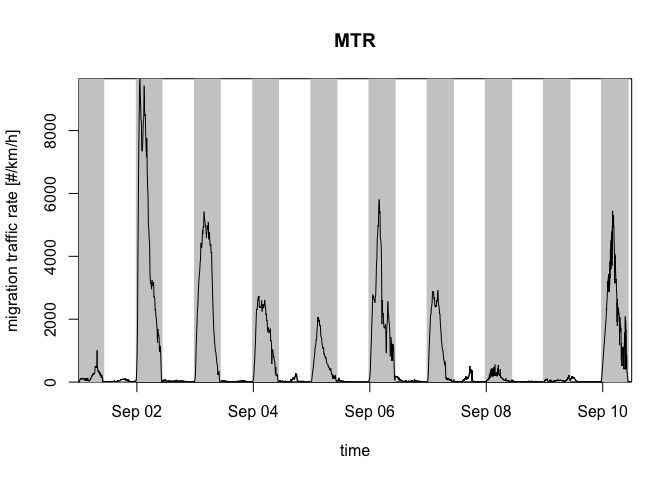
To know the total number of birds passing over the radar during the full time series, we use the last value of the cumulative migration traffic (column mt):
For more exercises, see this tutorial.
bioRad in R doing citation("bioRad").