![]()
SDLfilter contains a variety of functions to screen GPS/Argos locations and to assess the sample size of tracking data to optimise the analysis of animal distributions.
# The official version from CRAN:
install.packages("SDLfilter")

# Or the development version from GitHub:
install.packages("devtools")
devtools::install_github("TakahiroShimada/SDLfilter")There are three main filtering functions.
dupfilter filters temporal and spatial duplicates.
ddfilter filters locations with high error.
depthfilter filters locations by water depth.
## Fastloc GPS data obtained from a green turtle
data(turtle)

## Remove temporal and spatial duplicates
turtle.dup <- dupfilter(turtle)

## Remove biologically unrealistic fixes
turtle.dd <- ddfilter(turtle.dup, vmax=9.9, qi=4, ia=90, vmaxlp=2.0)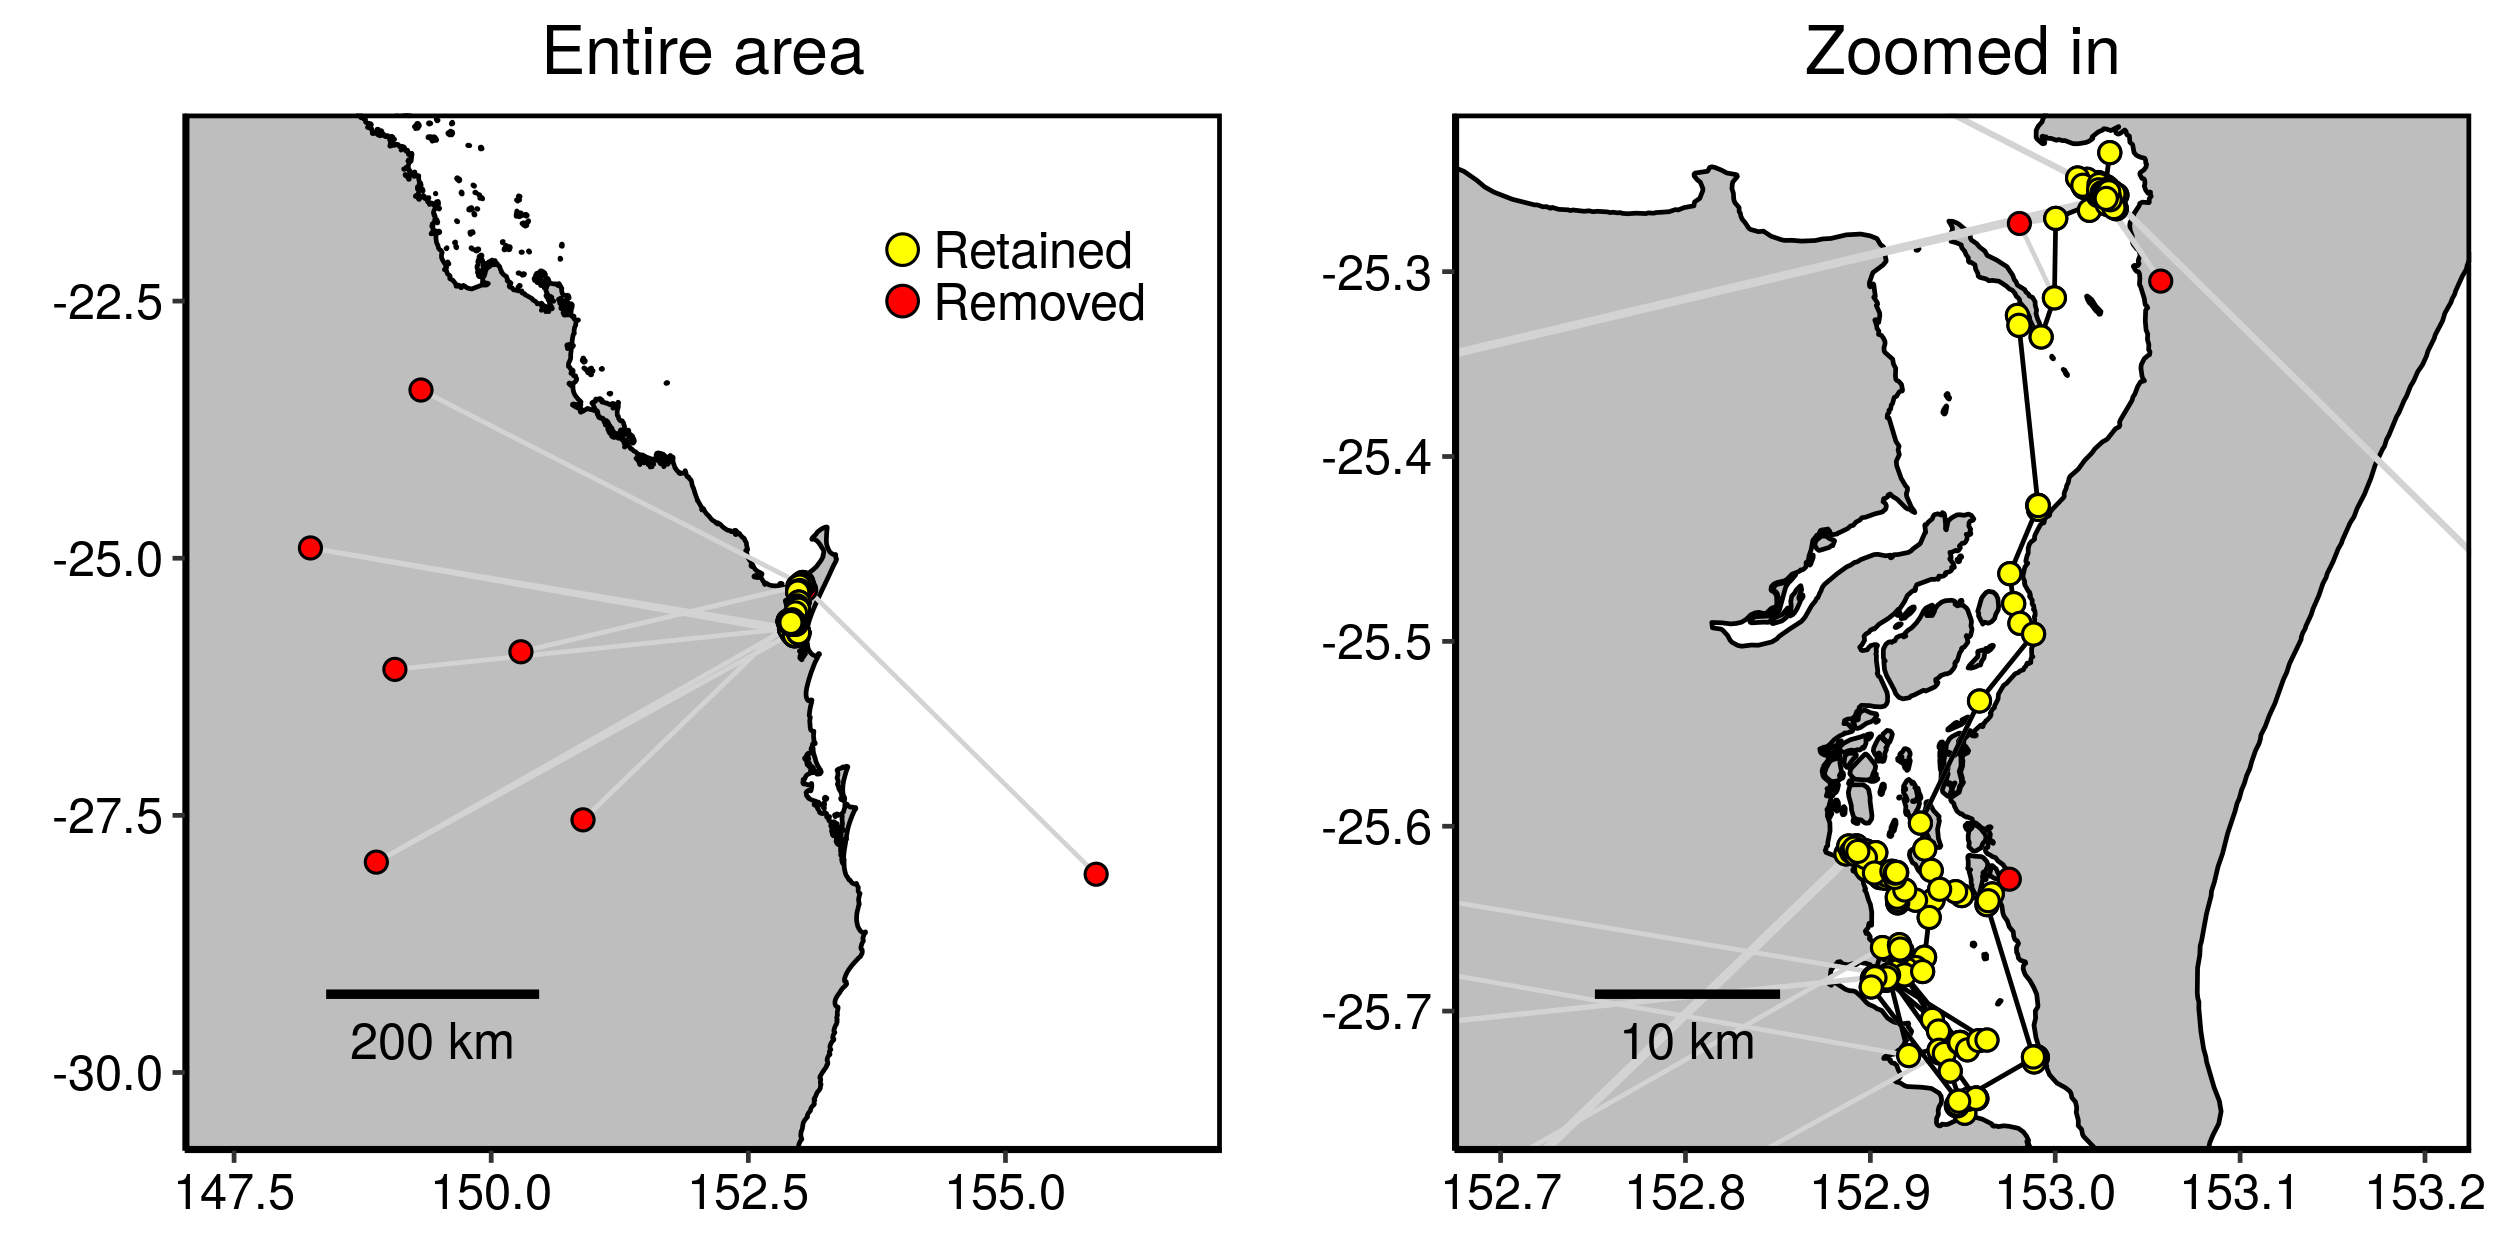
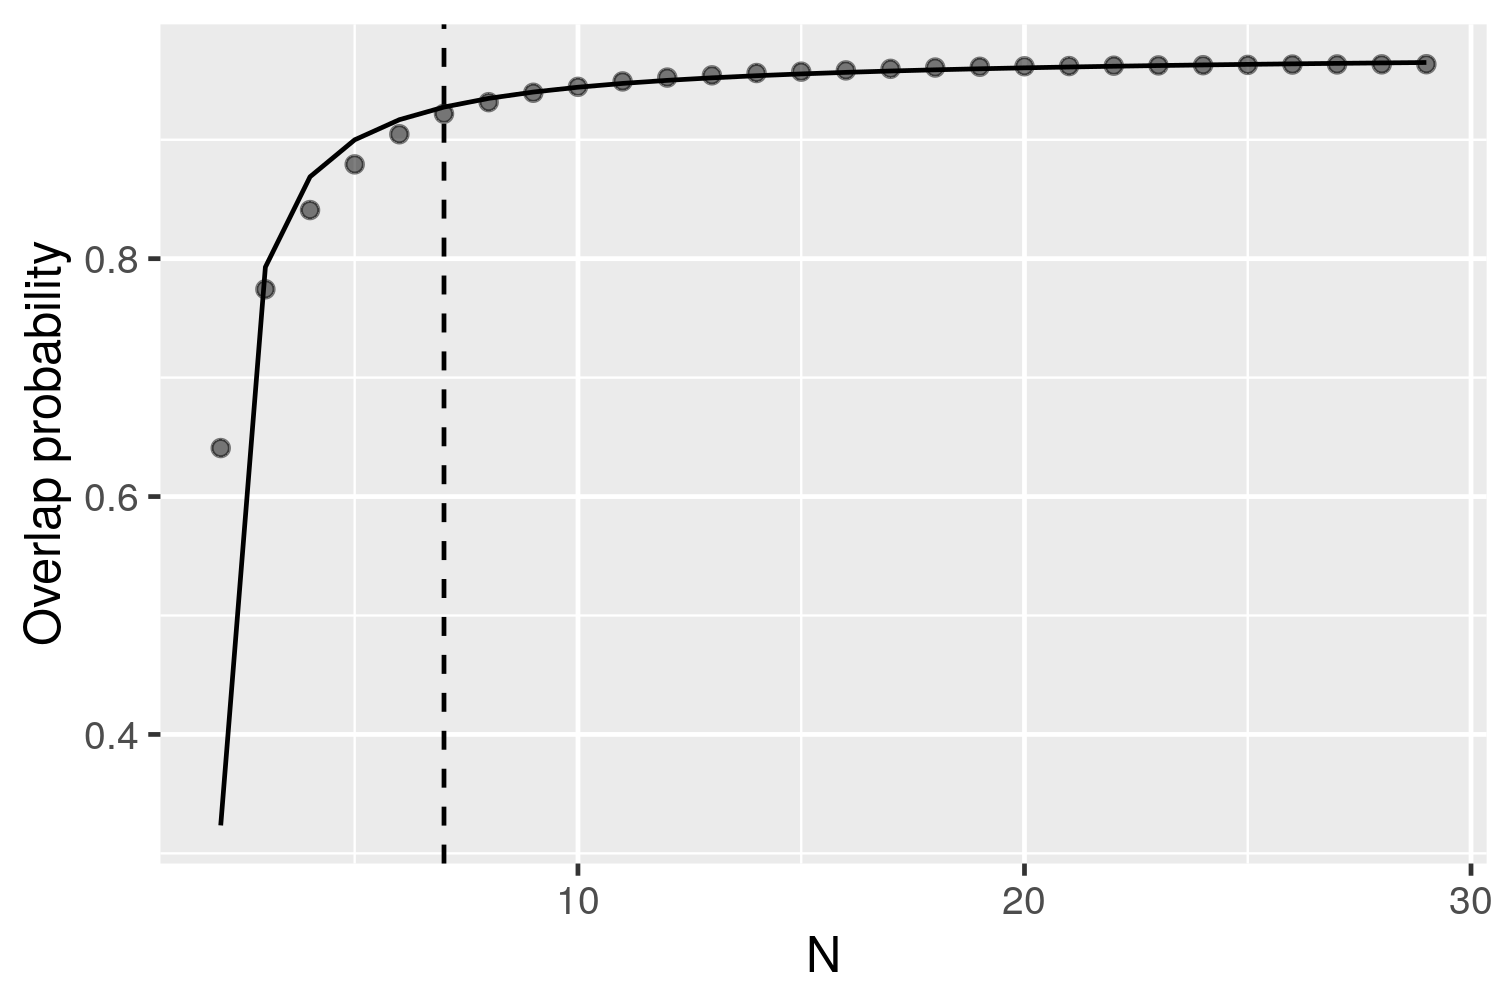
The input data can be either a matrix or a list of RasterLayer objects. Each row of the matrix or each RasterLayer object contains the probability distribution of an animal. The function assumes that each column of a matrix is associated with a unique geographical location, therefore it is critical that the grid size and geographical extent are the consistent across UDs. In this example, the grid size was 1km and the geographical extent was 1901789, 1972789, -2750915, -2653915 (EPSG:3577) across all 29 layers.
## 2. Calculate overlap probability from 1000 random permutation.
overlap <- boot_overlap(curtis, R = 1000, method = "PHR")
It will take some time to run this code depending on the number of iterations and the machine specs. The runtime was about 2.5 minutes for 1000 iterations on a linux machine (Intel i7-8650U CPU @ 1.90GHz, 32GB RAM).
## 3. Find the minimum sample size required to estimate the general distribution.
a <- asymptote(overlap)
As described in the main text, an asymptote was considered once the mean overlap probability exceeded 95% of the estimated horizontal asymptote. The sample size linked to this value was deemed to be the minimum sample size required to represent the general distribution of the group.
Please see the package help pages and Shimada et al. (2012, 2016) for more details.
If you use the function ddfilter, please cite
Shimada T, Jones R, Limpus C, Hamann M (2012) Improving data retention and home range estimates by data-driven screening. Mar Ecol Prog Ser 457:171-180 doi: 10.3354/meps09747
If you use the functions dupfilter or depthfilter, please cite
Shimada T, Limpus C, Jones R, Hazel J, Groom R, Hamann M (2016) Sea turtles return home after intentional displacement from coastal foraging areas. Mar Biol 163:1-14 doi: 10.1007/s00227-015-2771-0
Shimada T,…. (under review) Optimising sample sizes for animal distribution analysis using tracking data.
2.0.1 (4 July 2020)