The author of this package, Sagiru Mati, obtained his PhD in Economics from the Near East University, North Cyprus. He works at the Department of Economics, Yusuf Maitama Sule (Northwest) University, Kano, Nigeria. Please visit his website for more details.
Please follow his publications with his ORCID: 0000-0003-1413-3974
EviewsR is an R package that can run Eviews program from R Markdown.
EviewsR can be installed using the following commands in R.
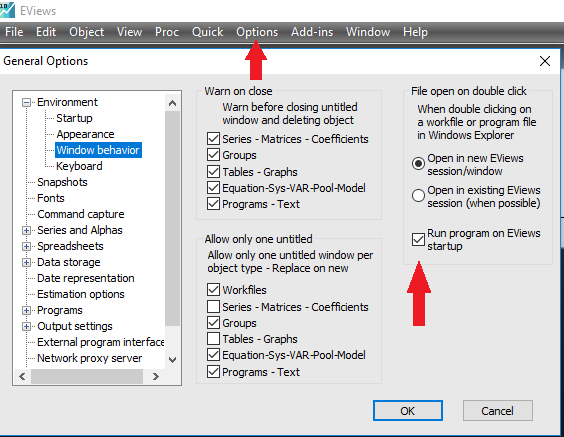
To run the package successfully, you need to allow Eviews program to run on Eviews startup. This can be set by clicking on options, General Options, window behaviour and ticking run program on Eviews startup as shown below:
Please load the EviewsR package as follows:
```{r EviewsR}                                                                .
library(EviewsR)
```
Then create a chunk for Eviews as shown below:
```{eviews EviewsR1,eval=T,echo=T,comment=NULL,results='hide'}                .
    'This program is created in R Markdown with the help of EviewsR package
  %path=@runpath
  cd %path
  wfcreate(page=EviewsR) EviewsR m 1999 2020
  for %y Created By Sagiru Mati Northwest University Kano Nigeria
  pagecreate(page={%y}) EviewsR m 1999 2020
  wfsave EviewsR
  next
  pageselect Sagiru
  genr y=rnd
  genr x=rnd
  equation ols.ls y c x
  freeze(EviewsR_OLS,mode=overwrite) ols
  EviewsR_OLS.save(t=csv, r=r7c1:r10c5) EviewsROLS
  EviewsR_OLS.save(t=csv) EviewsRtable
  freeze(EviewsR_Plot,mode=overwrite) y.line
  EviewsR_Plot.save(t=png) EviewsR_Plot_color
  EviewsR_Plot.save(t=png,-c) EviewsR_Plot_nocolor
  exit
```
The above chunk creates an Eviews program with the chunk’s content, then automatically open Eviews and run the program, which will create an Eviews workfile with pages containing monthly sample from 1999 to 2020. The program will also save an Eviews workfile named EviewsR in the current directory.
We can dynamically and reproducibly fetch the Eviews graph object we created with the Eviews chunk using the following R chunk:
For the color graph object:
or the black and white graph object:
we can also include the results of the OLS generated by the Eviews chunk using the following R chunk;
For the OLS result only:
or the entire OLS output:
Please see the example files for a better explanation.